

Work-related stress has shown to be a major risk factor for a range of adverse health outcomes, such as depression (1), coronary disease (2), and related mortality (3). It is also associated with reduced workplace safety (4) and substantial economic costs due to higher sick leave, lower work performance and staff turnover (5, 6). Absenteeism and presenteeism have found to be the major cost-drivers, often exceeding the costs of treatment (7, 8).
The efficacy of interventions for occupational stress has been demonstrated in a large number of randomized controlled trials (RCT) (9, 10). Despite the availability of evidence-based interventions, however, the majority of stressed employees do not use stress interventions to improve their distress.
Using the internet to provide self-help interventions may help to overcome some of the limitations of traditional stress-management interventions (SMI), such as limited availability, high threshold for participation and delivery costs (11, 12). A large amount of studies has shown that internet-based interventions can be effective (13) in clinical populations, such as depression (14–17), anxiety (18), and risky alcohol use (19) as well as in the field of prevention of mental disorders (20–23). Recently a number of trials showed that internet- and mobile-based interventions can be a valuable addition in occupational health including the treatment of insomnia among employees with work-related rumination (12, 24, 25), improving work-related stress (26–33) and the prevention and treatment of depression in workers (11, 34, 35). However, one trial revealed no significant results of internet-based interventions on depression in employees (36–38).
Whereas the efficacy of both face-to-face as well as internet-based approaches for managing work-related stress is well-documented, high quality data on whether such approaches provide good value for money is scarce. The most recent systematic review on economic analyses of occupational health programs was not able to identify any economic evaluation based on a randomized controlled design that focused on stress-management among workers (39).
As resources are restricted, however, employers are not just interested in the effectiveness of such an intervention, but also in the return-on-investment (ROI) (40). However, various intervention outcomes (ie, treatment response) cannot be easily monetarized and cannot thus be included in ROI analyses. Therefore, cost-effectiveness analyses (CEA) that compare the incremental costs and effects of the intervention and the comparator are also important (41).
Hence, the aim of the present study is to evaluate the cost-effectiveness and net-benefits of an internet-based SMI (iSMI) compared to a waitlist control (WLC) condition with unrestricted access to treatment as usual among employees with heightened levels of perceived stress. Analyses in the present study are conducted from the employer’s perspective focusing on costs and savings that are relevant to the employer (ie, productivity losses).
Method
Design
A two-armed RCT was conducted to compare a guided iSMI (GET.ON Stress) with a WLC. Both conditions had full access to treatment as usual. Assessments took place at baseline (T1), post-treatment (7 weeks, T2), and 6-month follow-up. Participants were primarily recruited via the occupational health program of a large health insurance company in Germany. Recruitment was directed at the general working population and not restricted to members of the healthcare insurance company. It occurred through announcements on the health care insurance company’s website, newspaper articles and advertisements in the membership magazine of the insurance company. Moreover, the insurance company’s occupational health management workers informed human resource departments of collaborating small- and medium-sized companies about the possibility for their employees to participate in the trial.
The present health economic evaluation followed guidelines from the ISPOR RCT-CEA Task Force Report and the recommendations of the Consolidated Health Economic Evaluation Reporting Standard (CHEERS) (42, 43). The ISPOR RCT-CEA Task Force report addresses issues related to trial design, selecting data elements, database design and management, analysis, and reporting of results. The aim of the CHEERS statement is to provide recommendations, in the form of a checklist, to optimize reporting of health-economic evaluations. A more detailed description of the study’s design can be found in the study protocol (29). In brief, this study was designed as a health-economic evaluation of an occupational stress-management intervention in employees alongside a randomized controlled trial from the employer’s perspective.
The sample consisted of 264 employees in Germany, who were randomly allocated with a ratio of 1:1 to the intervention (iSMI) or WLC group. An independent statistician performed the randomization with a web-based program (RandList). Both groups had full access to treatment as usual. Online-assessments took place at baseline (T1), post-treatment (seven weeks, T2), and 6-month follow up (T3).
Participants were primarily recruited via the occupational health program of a large health insurance company in Germany. Recruitment was directed at the general working population and not restricted to those who were insured by the healthcare insurance company. Recruitment was facilitated by announcements on the healthcare insurance company’s website, newspaper articles and advertisements in the membership magazine of the insurance company. Moreover, the insurance company’s occupational health management workers informed human resource departments of collaborating small- and medium-sized companies about the possibility for their employees to participate in the trial.
Participants were included in the study if they were 18 years or older, currently employed and scored ≥22 on the perceived stress scale (PSS-10). A cut-off value of one standard deviation above the mean PSS-10 of 15.3 [standard deviation (SD 6.2] in a large working population (44) was chosen. The exclusion criteria were suicide risk, and presence of dissociative and / or psychotic symptoms. The Ethics Committee of the Philipps-University of Marburg, Germany, approved the study. The trial was registered (DRKS00004749) in the German clinical trial registry.
Intervention
The iSMI (called “GET.ON Stress”) consisted of seven sessions and one booster session four weeks after training completion. The primary aim of this intervention was to reduce stress levels in employees. GET.ON Stress is based on Lazarus’ transactional model of stress (45) (for a detailed description of the intervention see (29, 46). It consists of two main components: problem solving and emotion regulation. Problem solving is an evidence-based method that has been proven to be successful in improving mental health (47). On the other hand, employees are also frequently faced with situations that require dealing with unsolvable problems; such situations are often associated with strong negative affective reactions and require effective regulation strategies. Numerous studies indicate that deficits in emotion regulation may be a relevant factor for the development and persistence of mental health symptoms (31, 32). Targeting emotion regulation skills has shown to be promising for reducing a broad range of psychopathological symptoms (48) and a mechanism of change in previous studies on GET.ON Stress (32). While problem-focused coping by means of problem-solving techniques is a well-established component of most CBT stress management trainings, the emotion-focused ways of coping could be regarded as the forgotten component. The intervention consists of eight sessions composed of modules for psycho-education (session 1), problem solving (sessions 2–3), emotion regulation (sessions 4–6), planning for the future (session 7) and a booster session (session 8). Additionally, participants are offered 11 modules that are integrated in sessions 2–6 and that can be chosen based on individual need and/or preference. Additional modules are directed at time management, rumination and worrying, psychological detachment from work, sleep hygiene, rhythm and regularity of sleeping habits, nutrition and exercise, organization of breaks during work, and social support (see table 1 for a session overview). Each session can be completed in approximately 45–60 minutes. We advise participants to do at least one and maximun two sessions a week. Consequently, the training lasts about 4–7 weeks (plus a booster session after 4 weeks). Once participants finish a lesson, they need to wait until they receive feedback from the accompanying e-coach to be able to start with the next lesson. Lessons consist of texts, exercises, and testimonials and also include interactive elements such as audio and video clips. Participants are encouraged to keep a daily online stress diary. A strong focus of the intervention lies on transfer tasks (homework assignments) to integrate newly acquired strategies and techniques into daily life. The training is adaptive as the content is tailored to the specific needs of the individual participant by continuously asking participants to choose among various response options. Subsequent content is then tailored to each participant’s response. Using responsive web-design, participants can follow the program on the internet, a tablet or mobile phone. An integrated read-aloud function allows participants to follow narrated lessons. If desired, participants received automatic motivational text messages and small exercises on their mobile phones. These messages aim to support participants in transferring the exercises of the training into their daily lives (eg, short relaxation exercises: “Relax your muscles in your hands and arms for 3 seconds now. Follow your breathing and each time you breathe out, relax a little more.”). The participants had the opportunity to choose between “light coach” (one text message every other day) and “intensive coach” (2–3 text messages every day) options. Participants were supported by an e-coach holding a degree in psychology who followed a standardized manual for writing feedback. The e-coaches provided personalized feedback throughout the intervention. Participants completed on average 5.7 sessions (SD 2.32), used the intervention for a mean of 8.27 weeks (SD 8.54, range 0–56), and 93/132 (70.5%) completed all seven sessions. Ten participants (7.6%) did not start the intervention due to lack of time or changes in personal circumstances. Every participant received a maximum of 30 minutes of feedback per session of an e-coach, resulting in a maximum total of 3 hours (rounded) per participant over the whole course.
Table 1
Demographic characteristics. [SD=standard deviations; iSMI=internet/mobile-supported stress management intervention; %=percentages at baseline; WLC=waitlist control; PSS=perceived stress scale.]
Outcome measures
Clinical outcome
The primary outcome of the CEA was the number of participants who achieved symptom-free status as measured by the PSS-10 (49). The PSS consists of 10 items rated on a 5-point Likert scale (0=never; 1=almost never; 2=sometimes; 3=fairly often; 4=very often; range 0–40) referring to the past week. Cronbach alphas ranged from 0.70–0.91 over different measurement points in this study (32). The symptom-free status was achieved when participants scored >2 SD below the mean (T1) of the stressed population (25.52, SD 3.91) as according to Jacobson & Truax (30, 50).
Cost outcome
Only costs that were directly relevant for the employer were considered: (i) intervention costs, (ii) costs, due to absenteeism, and (iii) costs due to presentism. Data on productivity losses (absenteeism and presenteeism) due to health problems were assessed at baseline and 6-month follow-up using the relevant module of the “Trimbos Institute and Institute of Medical Technology Questionnaire for Costs Associated with Psychiatric Illness” (TiC-P) adapted to the German context (51). The TiC-P is a self-report questionnaire with a 3-month recall period in the current study. It is a widely used (24, 29, 32, 33, 52) instrument for collecting data on healthcare utilization and productivity losses in patients with mild-to-moderate mental health conditions (53). The TiC-P has shown a good test–retest reliability indicated by a satisfactory Cohen’s kappa for most items related to healthcare consumption and items absent from work as well as presenteeism (54). Cumulated costs over the six months of the trial were estimated using the area under curve (AUC) method to linearly interpolate 3-month costs as measured at each measurement point to cover the full follow-up period of six months (54).

All costs were calculated in euros (€) and indexed for the reference year 2013 (index factor 1.04) based on the German consumer price index (55).
Absenteeism
In order to measure absenteeism, participants reported how many days they had been absent from work during the previous three months (lost work days). Absenteeism cost were calculated by applying the human capital approach (53). In doing so, the number of lost work days was multiplied by the participant’s average gross daily wage based on their reported monthly salary.
Presenteeism
Presenteeism occurs when people feel ill and therefore are less efficient during work. In order to quantify the costs due to presenteeism, the participants reported both the number of days that they felt ill but continued to work and their personal inefficiency score on a scale from 0–10, where 0 reflects total inefficiency and 10 reflects that they were as efficient as when in good health. Lost work days due to presenteeism were computed by multiplying the number of work days with reduced functioning by the corresponding inefficiency score. This method is called the Osterhaus method (56). Subsequently, based on self-reported monthly salary, their gross wages per hour were calculated and used to calculate the costs that occurred due to presenteeism.
Costs of the intervention
The provider of GET.ON Stress estimated the average price of the intervention to be €299 per participant. This flat tariff contains all costs for developing, providing, website hosting and maintenance, as well as guidance and 19% VAT. Opportunity costs were not included since we assumed that participants would want to use the intervention at home and not at work.
Statistical analysis
This heath economic evaluation was conducted alongside a randomized trial powered to detect a mean standardized difference of d=0.35 in the primary outcome (PSS-10) between the groups at post-measurement. However, it is worth noting that cost data usually have a large variance, which would require very large samples to test economic hypotheses. Such large samples are most likely prohibitive from a financial, logistical and medical-ethics point of view. Therefore, the study was not powered to statistically test differences in economic outcomes. Instead, a probabilistic decision-making approach for making health-economic inferences was used (57). This procedure takes the uncertainty about key parameters (in costs and effects) into account (58, 59) and informs decision-makers on probabilities rather than statistical significance. Perfect information is only available in very few decision-making situations. Probabilities account for the amount of risk each decision carries.
All analyses were conducted in accordance with the intention-to-treat (ITT) principle. All 264 participants completed the PSS and the cost measures at baseline. The missing data was assumed to be missing completely at random as indicated by the Little’s overall test of randomness. Missing cost data at T3 (wage, weekly working hours, presenteeism days, absenteeism days) were imputed using the regression imputation procedure in Stata version 13 to obtain predicted values of missing data. Predictors of outcome and dropout were identified by (logistic) regression. Baseline costs of presenteeism and absenteeism, wage, working hours as well as demographic variables, including age, and gender were found to be significant predictors for both categories and were thus included as predictors in the imputation model.
Cost–benefit analysis (CBA)
This study proceeds on the assumption that the employer is the one who pays for the intervention and benefits from cost savings due to decreased presenteeism and absenteeism. Benefits were defined as the difference in total monetarized outcome measures (ie, absenteeism and presenteeism) between study conditions. Positive benefits point to reduced spending. Costs were defined as the intervention costs, which are assumed to be paid by the employer for each employee (estimated at €299). This amount represents the current market price for the complete intervention, which includes access to seven modules + one booster session for 12 months, one individual written feedback per completed lesson and replies to individual questions from the participant on demand until completion of the booster session.
In the present study, the following metrics for costs and benefits are reported: (i) the net benefits (NB = benefits - costs), the money saved after cost deduction; (ii) the benefit-to-cost ratio (BCR = benefit/cost) to measure the benefits against the costs; and (iii) the return-on-investment (ROI=NB/costs), the amount in euro returned per one euro invested (40, 60).
Statistical uncertainty is taken into account by bootstrapped 95% confidence intervals (95% CI) which are estimated around these measures with 5000 replications using the bias-corrected and accelerated bootstrap procedure as implemented in Stata version 13 (40, 61). Cost savings are indicated when following criteria are met: NB>0, BCR>1, and ROI>1 (40, 62).
Cost-effectiveness analysis
For the CEA, costs and cost offsets (presenteeism + absenteeism + intervention costs) and effects (number of participants with symptom-free status) were calculated for the 6-month period. Subsequently, costs and outcomes were combined into the incremental cost-effectiveness ratio (ICER) using the following formula:

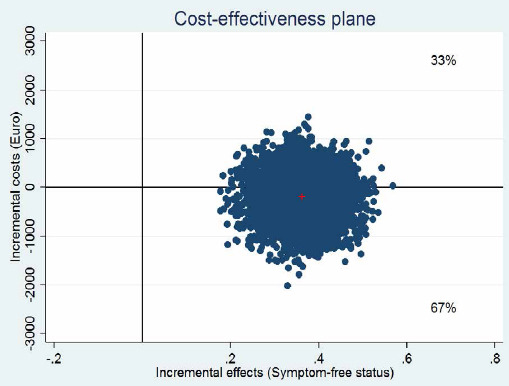
Since cost data tend to be skewed to the right (58), we used non-parametric bias-corrected accelerated bootstrapping resampling techniques (with 5000 replications) to assess uncertainties surrounding the ICER. The bootstrap analyses were undertaken in the context of Stata’s procedure for seemingly unrelated regression equations (SURE) to simultaneously assess incremental costs and incremental effects. The generated ICER were plotted in a cost-effectiveness plane. On the plane, incremental effects between intervention group (IG) and control group (CG) are depicted on the x-axis and the incremental costs between IG and CG are depicted on the y-axis.
If the majority of simulated ICER fall in the south-east quadrant, the intervention is considered to “dominate” the active control groups because better effects are obtained for lower costs. In contrast, in the north-west quadrant the intervention is considered “inferior” to the control group since it is associated with higher costs and worse health outcomes and therefore not considered to be cost-effective (41). ICER in the south-west quadrant point to an intervention being less effective but also less costly than the control condition. Finally, ICER in the north-east quadrant reflect an intervention being more effective and more costly than control condition. In this case, the amount of money a decision-maker is willing to pay for one additional positive outcome is crucial for a new intervention to be adopted or not. The probability that the intervention is cost-effective compared to CG at various willingness-to-pay (WTP) ceilings for one treatment response gained can be shown by the means of the cost-effectiveness acceptability curve (63).
Sensitivity analysis
The robustness of the findings was assessed by performing sensitivity analyses over a range of intervention costs. In the main analysis, we used intervention costs of €299. However, there is uncertainty concerning these costs, as intervention costs may differ once implemented into occupational routine care, for example due to changing demand, supply in the health sector, and preferences of employer and employees. Therefore, two additional sensitivity analyses were conducted assuming higher and lower intervention costs (with ± €100).
Results
Sample
Table 1 presents the baseline characteristics; a comprehensive description can be found in the paper describing the primary efficacy results (30).
Study drop-outs
The study attrition rate was low: 10.6% (28/264) of participants did not complete the 6-month follow-up questionnaires [N=17/132 (12.8%) for the iSMI and N=11/132 (8.33%) in the WLC; χ2=1.16; P>0.05]. Persons who dropped out did not differ in a meaningful way from those who provided data, neither on baseline stress scores nor any other baseline outcomes, with the exception of worrying (P<0.05).
Clinical outcome
The effect outcome for the CEA was symptom-free status defined at <17.70 on the PSS-10. Therefore, at T3 79/132 (59.8%) in the iSMI were significantly more participants classified as symptom-free compared to 31/132 (23.5%) in the WLC [NNT (number needed to treat)=2.73; χ2=15.0; P<0.001]. On average, the iSMI improved by 9.75 (SD 6) PSS scores between pre- and 6-month follow-up whereas the WLC improved by 3.0 (SD 6) PSS scores. The analysis of covariance (ANCOVA) confirmed lower scores on the PSS-10 (relative to the WLC) were found in the iSMI group at T3 [F1,261=80.17, P<0.001, with large between-group effect sizes (d=1.02; 95% CI 0.76–1.27)] (50).
Costs outcome
Table 2 shows mean presenteeism and absenteeism days, and similarly hourly wage for the 6-month follow-up assessment. In addition, cumulated costs for the intervention, presenteeism, and absenteeism as well as total cost per group and between-group cost differences are reported. Presenteeism cost (iSMI: €1346; WLC: €1655) caused slightly lower costs compared to absenteeism cost (iSMI: €1578.2; WLC: €1756.6) in both groups. The mean difference in indirect costs (iSMI–WLC) at the 6-month follow-up was €488 per person favoring the intervention group. In the intervention group (iSMI), each participant produced costs of €299 (intervention costs) and therefore saved €189 (SD 434) on average compared to the control group (WLC) in the first six months.
Table 2
Hourly wage, absenteeism, presenteeism, and related costs categorized by condition at 6-month follow-up. [IG=intervention group; CG=control group, WLC=waitlist control, iSMI=internet-based stress-management intervention; SD=standard deviation.]
| IG (iSMI) (N=132) | CG (WLC) (N=132) | |||||
|---|---|---|---|---|---|---|
| Mean | SD | Mean | SD | Mean | SD | |
| Hourly wage (euros) a | 21.54 | 6.7 | 21.68 | 7.9 | ||
| Absenteeism days b, a | 3.64 | 6.7 | 5.23 | 12.2 | ||
| Presenteeism days b, a | 11.32 | 12.9 | 11.47 | 11.9 | ||
| Indirect costs (euros) c | ||||||
| Absenteeism (euros) a | 1578.18 | 1471 | 1756.35 | 1848 | ||
| Presenteeism (euros) a | 1345.79 | 2184 | 1655.16 | 3436 | ||
| Intervention costs (euros) | 299 | |||||
| Total costs (euros) | 3223 | 2787 | 3412 | 4133 | -189 | 434 |
Cost benefit analyses (CBA)
The results of the conducted CBA and sensitivity analyses are reported in table 3. Calculations, based on the intervention costs at €299 and costs per person of €3412 in the WLC and €3180 in the iSMI, yielded a net benefit of €181 and a benefit-to-cost ratio [BCR (benefit/costs)] of 1.6 (95% CI -1.2–4.5) after 6 months. Moreover, the [(benefits - costs)/(costs × 100)] was 0.6 (95% CI 2.2–3.5) meaning the employer gains €0.60 for every euro invested within the time span of six months.
Table 3
Results of the main and sensitivity analyses (based on 5000 bootstrap simulations) with N=132 per group. [CI=95% confidence interval, SA=sensitivity analyses; NB=net benefit; BCR=benefit cost ratio; ROI=return on investment]
| Analysis | Costs | Benefits | Financial return | |||||
|---|---|---|---|---|---|---|---|---|
| Total (euros) | Total (euros) | NB a | 95% CI | BCR b | 95% CI | ROI c | 95% CI | |
| Main analyses | 299 | 488 | 181 | -643–1042 | 1.6 | -1.2–4.5 | 0.61 | -2.2–3.5 |
| SA1 (-100 euros) | 199 | 488 | 281 | -543–1142 | 2.4 | -1.7–6.7 | 1.4 | -2.8–5.7 |
| SA2(+100 euros) | 399 | 488 | 81 | -743–942 | 1.2 | -0.8–3.4 | 0.2 | -1.9–2.4 |
Cost-effectiveness analyses (CEA)
Table 4 reports the results of the CEA. ICER (C1 - C0)/(E1 - E0) is defined as the incremental difference of mean costs between two groups (CG - IG) divided by the incremental difference in positive effects, ie, the amount of symptom-free persons. The IG produced less indirect costs compared to the CG (€3223 versus €3412). Hence, the ICER formula (322 - 3412)/(0.6 - 0.2) yields an adjusted point estimate of -€-521 (95% CI -3123–1900). The negative ICER falls in the south-east quadrant is therefore dominant.
Table 4
Cost-effectiveness analyses based on 5000 replicates of the incremental cost-effectiveness ratio (mean differences in costs from the employer’s perspective and in symptom-free status). [CI=confidence interval, SA=sensitivity analysis IG=intervention group, CG=control group, ΔC= incremental costs, ΔE= incremental effects, ICER= incremental cost–effectiveness ratio, NE= eorth-east quadrant, SE=south-east quadrant, SW=south-west quadrant, NW=north-west quadrant]
Figure 1 shows the cost-effectiveness plane in which each dot (N=5000) represents one of 5000 bootstrapped replicated ICER. The bulk of ICER fall in the south-east quadrant, indicating that there is a 67% probability that the iSMI generates greater health effects at lower costs compared to the WLC.
Figure 1
Scatter plot showing the mean differences in costs and effect outcome (symptom-free status) data using 5000 bootstrap replications.
Supplementary Figure 2 (www.sjweh.fi/show_abstract.php?abstract_id=3691) presents the cost-effectiveness acceptability curve, which helps decision-makers decide if the intervention provides “good” value for money given varying willingness-to-pay thresholds. If the employer is willing to pay zero, respectively €500, €1000, €2000 for one additional symptom-free person, there is an 80%, 90% and 98% probability that the IG is more cost-effective than the WLC.
Sensitivity analyses
Both tables 3 and 4 demonstrate results based on the sensitivity analyses. The ICER increased up to -€804 when assuming lower treatment costs (SA1) and the net-benefit rose to €281. When assuming higher intervention costs (SA2), the ICER drops to -€238 but the intervention still has a 58% probability of gaining greater health effects at lower costs compared to the control condition.
Discussion
Main results
The present study took the employer’s perspective to evaluate the health economic impacts of an internet-based mobile-supported SMI. Both CEA and CBA indicated that providing the intervention to employees with elevated symptoms of stress is likely to present good value for money in occupational healthcare. The CEA demonstrated a 67% likelihood that the intervention was more cost-effective than no immediate intervention. Likewise, our CBA indicated net-savings of €181 on average per participant already in the first six months following the intervention, with a return on investment of €0.61 per euro invested in the intervention. These savings are mostly due to reductions in absenteeism and presenteeism costs. The estimates can be seen as conservative, as costs due to absenteeism and presenteeism were calculated based on the employee’s gross wage only. Costs that occur as a consequence of absenteeism and presenteeism such as reduced productivity and loss in earnings for the employer due to presenteeism and absenteeism were not taken into account. Sensitivity analyses confirmed the robustness of the findings. If the employer is only willing to pay nothing or €500 for an additional symptom-free person, then there is a 67% and 82%, respectively, probability that the intervention is deemed more cost-effective compared to no immediate intervention.
Comparison with previous findings
This study is, to the best of our knowledge, the first to investigate the cost-effectiveness of a SMI from the employer’s perspective. Our results compare favorably to the average ROI [-0.91 versus -0.22 (SD 2.41)] found in 12 RCT in the latest review (39) on the costs and benefits of health promotion at the workplace. The CEA are in line with a recent study on an internet-based intervention targeting insomnia in workers that found a net-benefit of €418 (95% CI -593.03–1488.70) per participant and an ROI of 208% (95% CI -296.52–744.35) (64). Interestingly, the reduction in costs in both studies was mainly driven by the effects of the intervention on presenteeism and to a lesser degree by reduced absenteeism. These findings emphasize the importance of taking indirect cost due to presenteeism into account when investigating health economic effects of interventions in the work-setting. However, our follow-up period was limited to six months only. As chronic stress is associated especially with poor economic consequences in the long run, longer follow-up periods may help to shed light on the true potential and cost savings of the intervention. Such an assumption is supported by one of the few modelling studies that modelled the potential cost-benefit of implementing mental health care interventions in the workplace. They found a net benefit of US$30 per participating worker in year 1 and US$257 in year two following the treatment (65). However, future studies are needed to determine the long-term economic impact of occupational mental health interventions.
Limitations
Limitations of our study include the fact that our large-scale trial was still underpowered for economic analyses. This is a common problem in health-economic evaluations conducted alongside a clinical trial, as cost variables often have a higher variance and generally require greater sample sizes than clinical evaluations (59). Like most randomized trials, the present study was only powered to detect findings on the primary clinical outcome, and in such cases a probabilistic decision-making approach is usually used (58, 59). However, once more studies focusing on a similar target are published, pooling techniques such as individual participant data meta-analyses may be used to overcome this power problem (66–68). Second, only severely distressed participants with high baseline scores (PSS >22) were included in the study. Hence, the results may not apply to populations with lower stress levels and future studies should explore the cost-effectiveness probability for employees with lower stress-levels. Third, self-selection of the participants restrict the generalizability of results to employees willing to utilize such an intervention, with females being more likely to participate. Future studies should focus on reaching men for occupational SMI. Fourth, the assessment of costs due to absenteeism and presenteeism was based on self-reported data. Although this procedure has exhibit reasonably good reliability and validity (53, 69–71) and is standard procedure in health economic outcome evaluations alongside RCT (72), subjective data are prone to certain biases and hence the total costs in both groups may be either an overestimation or underestimation of true overall costs. Fifths, other work-related costs such as staff turnover, early retirement, and somewhat intangible costs such as the firm’s reputation as a bad/good place to work were not included and could lead to greater cost-savings. Moreover, we used wages as a basis for measuring productivity costs, which might be a good proxy for true productivity costs only under certain conditions, as the method used ignores, for example, cases in which additional efforts of co-workers compensate productivity lost due to absenteeism and presenteeism of colleagues. Sixth, a WLC design with access to treatment as usual has been chosen where treatment as usual without delayed access is regarded as favorable control conditions (73). Finally, the present evaluation focused solely on costs relevant for the employer and excluded other costs that are relevant for the society, such as direct medical costs. Although indirect costs are often the major cost driver in stress-related health problems accounting for 50–80% of all associated costs (6, 7), future studies should also evaluate the cost-effectiveness from other perspectives, such as the societal or healthcare perspective.
Concluding remarks
There is substantial evidence for the effectiveness of psychological interventions for improving mental and work-related outcomes. However, methodological sound studies on the health economic effects of such interventions are still limited. The present study is the first showing that investing in internet-based stress-management interventions is associated with a high probability for a positive financial return, even when only focusing on costs that are relevant for the employer. In conclusion, when future studies could replicate the current findings, investing in digital interventions aiming to improve mental health at the workplace may be beneficial for employers as seen from a corporate health-economic and business point of view.