

Silica is a very common chemical compound and a major component of the Earth’s crust; it can take different forms (crystalline, amorphous, silicates, etc.). As crystalline silica, it is found in many materials extracted from mines and quarries which are used in professional environments. These include sand for concrete and glass production, and clay for ceramic production. Crystalline silica dust is one of the oldest known occupational exposures, and many occupational activities are still subject to it (1). The respiratory diseases caused by respirable crystalline silica dust (‘silica dust’ hereafter) are mainly pneumoconioses (silicosis being the best known), chronic obstructive pulmonary diseases, and bronchopulmonary cancers. In 1997, the International Agency for Research on Cancer (IARC) classified crystalline silica dust as carcinogenic for lung cancer in humans. Other forms of silica are neither classified nor regulated. In France, diseases from workplace exposure to silica dust have been classified as occupational diseases since 1945, and their treatment is fully covered for free by the national health insurance system (silicosis, lung cancers, scleroderma). The first French occupational exposure limits (OEL) to silica dust were defined in 1983.
Studies in France and other countries have determined that occupational exposure to silica dust is still a problem today (1–7). In 2017, a global burden of disease study estimated there were 23 700 (19 100–29 000) cases of silicosis worldwide. Although this number is decreasing, silicosis is still the most common type of pneumoconioses (8). In 2019, the French Agency for Food, Environmental and Occupational Health & Safety (ANSES) published an expert report showing the emergence of new occupational exposure contexts for silica dust linked to the use of artificial stone (eg, kitchen fitters) (9).
In December 2017, the European Union classified work involving exposure to silica dust generated by a work process as carcinogenic (10). This classification led to the implementation of compulsory regulation in France on 1 January 2021 (11). One of the consequences of this is the mandatory monitoring of workplace exposure and the elimination or limiting of the most dangerous work processes.
Job-exposure matrices (JEM) are a very useful tool in occupational epidemiology to assess occupational exposure in a large population and exposure to agents, which workers themselves find difficult to identify. To estimate occupational exposure to silica dust among workers in France, we created a JEM specific to silica dust (silica-JEM hereafter) as part of the Matgéné program, which aimed to create various retrospective population-based JEM for different substances. Previous estimations based on the silica-JEM, and on a sample representative of the working population in France (including occupational history calendars), highlighted that 3.1% of all workers (5.6% of men and 0.3% of women) in the country were exposed to silica dust in 2007. These estimated that 15.6% of men had had at least one job in their occupational lifetime where they were potentially exposed to this agent (12).
Linking the silica-JEM – which assesses exposure between 1947 and 2020 – with census data, we investigated the evolution in the proportions and numbers of workers exposed to silica dust in France between 1982 and 2017, and described these proportions according to sex and industry for 2017.
Method
Exposure assessment
As part of France’s Matgéné program, two industrial hygienists (IH) developed the silica-JEM to assess exposure to silica dust from 1947 to 2020 for the working population.
In the silica-JEM, jobs (defined as an occupation in an industry) are coded using French and international classifications (see supplementary material, www.sjweh.fi/article/4105). For the present study, only French classifications were used as follows, always at the most precise level: 4-digits PCS1982 and 4-digits PCS2003 for occupations; 4-digits NAF1993, 4-digits NAF2003 and 5-digits NAF2008 for industries (13–17). Nomenclature d’activités française (NAF) is the French adaptation of the European Nomenclature of Economic Activities (NACE) revision 2 and the International Standard Industrial Classification (ISIC) revision 4 (18) (19).
Three exposure indices exist for each job in each JEM version as follows: (i) exposure probability is defined as the proportion of workers exposed to silica dust in their workplace (11 classes); (ii) exposure intensity represents the mean atmospheric concentration of silica dust to which a worker is exposed during the current tasks. It also takes into account the mean atmospheric concentration in the surrounding environment (4 classes). The proportion of exposure due to the tasks and the proportion from the surrounding environment could not be distinguished. Moreover, exposure peaks are included in the intensity assessment. This assessment takes into consideration the collective protective equipment but not the personal protective equipment as it is not possible to know if they are appropriate, properly fitted or even used; (iii) exposure frequency is defined as the percentage of worktime during which the worker is exposed (11 classes); and (iv) the mean exposure level for a specific job during an 8-hour working day can be calculated by multiplying the frequency by the intensity (using the mid-point values of the classes).
The two IH in charge of this project assessed all the combinations (occupation/industry sector/period) considered exposed and the indices. To this end, the IH researched data on work processes (tasks, materials, tools…) to identify all the occupational circumstances with silica exposures and created a database with measurements data found (literature, thesis, open databases…). The measurements helped the expertise by giving information about some tasks or some occupations (mostly on the intensity of the exposure). These data did not give information for every combination and were not used to automatically fill the JEM cells.
For each combination, the IH assessed, by consensus, with the help of the information gathered: the intensity of the exposing tasks, the frequency of exposure and the probability of exposure.
Study population data
To study the trend of occupational exposure to silica dust in France between 1982 and 2017, we used the National Institute of Statistics and Economic Studies (INSEE) population census data (20), which included information on respondents’ job. These aggregated data describe the numbers of workers in France by occupation, industry, age, sex, and department of residence (a ‘department’ is an administrative level in France similar to a ‘county’) for the years 1982, 1990, 1999, 2007 and 2017. The INSEE census method evolved during the study period. The 1982, 1990 and 1999 censuses were exhaustive and each household was obliged to complete the census form. Since 2004, population censuses have become annual and are based on a rolling 5-year sample (ie, data are renewed only every 5 years). As a result, the 2007 and 2017 censuses take into account data from the annual censuses of 2005 to 2009 and 2015 to 2019, respectively. We did not consider this to be a bias in the present study, as INSEE made adjustments to ensure the data collected from the two different methods could be compared (21). For the oldest census (ie, 1982 and 1990), occupational data codes were cross walked into the NAF1993 classifications using an INSEE table.
Statistical analysis
Census data were linked with the silica-JEM using the occupation and industry codes and the exposure period corresponding to each census year. The number of persons with a specific job potentially exposed to silica dust was calculated by multiplying the exposure probability provided by the silica-JEM (centre value of the probability class) by the number of workers with the job. The proportion of exposed workers was obtained by dividing the sum of potentially exposed workers by the number of workers in the French working population. A sensitivity interval (SI) was calculated by taking the lower and upper bounds of each probability class. All results regarded workers in metropolitan France (ie, the European territory of France) aged 20–74 years. Exposure indicators were described according to sex and industry group. Results are presented in NACE and ISIC industrial classifications to help comparison with international data. The indicators were also described by occupation, but results are not presented here as there is very little similarity between the French and international classifications for occupation.
The exposure level, representing the 8-hour exposure, was calculated by multiplying the intensity and the frequency, using the mid-point values. This exposure level was considered high when it was >0.1 mg/m3 [ie, the French 8-hour time weighted average occupational exposure limit (TWA-OEL)].
Results
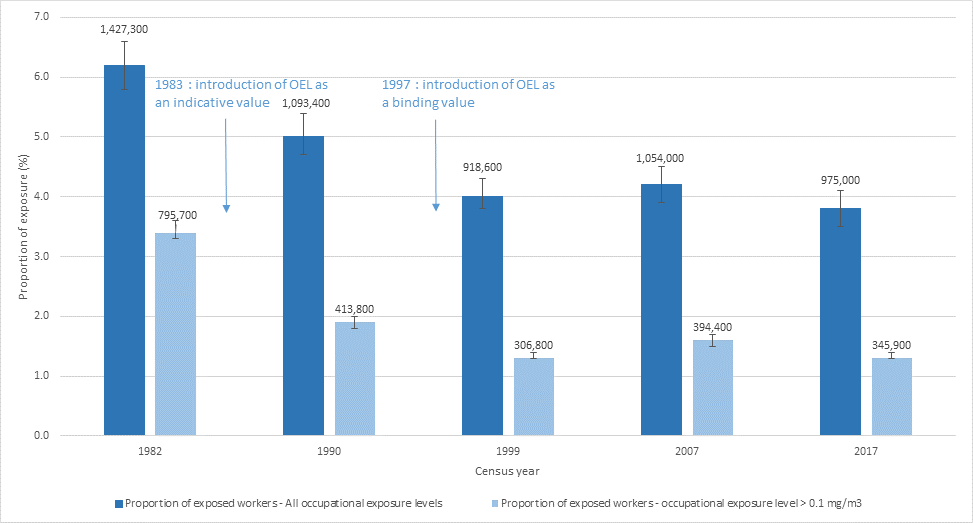
Using the silica-JEM, we found that the proportion of workers exposed to silica dust aged 20–74 years decreased from 6.2% to 4.0% between 1982 and 1999, and then remained stable (3.8% in 2017) (figure 1). This represents 1 400 000 (SI 1 340 000–1 534 500) exposed workers in 1982 and 975 000 (SI 906 600–1 056 000) in 2017. The proportion of workers with high exposure also decreased over this period, with a 61% reduction (3.4% in 1982 versus 1.3% in 2017).
Figure 1
Evolution between 1982 and 2017 of the proportion and the number of workers exposed to silica dust in France.
In 2017, 975 000 workers were exposed to silica dust; of these, 345 900 had a high level of exposure. Most of those exposed were men (93%, 910 000 workers). Among men in 2017, 210 000 workers were exposed in the ‘other specialized construction activities’ sector (ISIC 4390), which includes masonry work (table 1); 97 000 were exposed in the ‘building completion and finishing’ (ISIC 4330) category, while 82 000 and 66 000 were exposed in the ‘electrical installation’ (ISIC 4321) and ‘plumbing, heat and air-conditioning installation’ (ISIC 4322) sectors, respectively. Exposed men were also observed in the ‘general public administration’ (ISIC 8411) and ‘temporary employment agency activities’ (ISIC 7820) sectors. Exposure in these two sectors was also linked to construction tasks. Some smaller industry sectors had fewer exposed men, but the proportion of those exposed in both sectors was high. For example in the ‘manufacture of articles of concrete, cement or plaster’ (ISIC 2395) sector, only 11 000 men were exposed, yet they represented 42% of the workforce in this sector.
Table 1
Proportion and number of male workers according to activity sector in 2017 as per the ISICS and NACE industrial category classifications. a [SI=sensitivity interval.]
a Example of how to read this table: In ISIC 4390, 59.9% of the male workers are exposed to silica (210 057). Among them, 71% are exposed to a level >0.1 mg/m3. b High exposure among those exposed is >0.1 mg/m3 (the French 8-hour TWA-OEL).
In terms of high exposure (ie, >0.1 mg/m3) in 2017, the sector most concerned was ‘other specialized construction activities’ (ISIC 4390), with 71% (SI 68–75) of exposed male workers having high exposure (148 000 workers).
Despite having a much lower likelihood of exposure to silica dust than men, 65 000 women in France were still exposed in 2017. For the most part, the industrial sectors where exposed women worked were very different from those for exposed men (table 2). What is specific to exposed women is that 29 500 of them worked in a multiplicity of industrial sectors; each of these sectors represented <5% of the total number of exposed women. The ‘general public administration’ sector had 14 000 exposed women, representing a very small proportion of the workforce in this sector (1.4%). The ‘building completion and finishing’ and ‘other specialized construction activities’ sectors (which were the two principal sectors for men) had 3400 exposed female workers in each (7.4% and 10% of the workers of these sectors, respectively). Women were more exposed than men in certain industry sectors. This was the case for example in the ‘manufacture of other porcelain and ceramic products’ sector (2300 exposed female workers, accounting for 54% of the total number of female workers in this sector), and the ‘manufacture of glass’ sector (2100 exposed female workers, accounting for 25% of the total number of female workers in this sector). Just as was observed in men, the ‘other specialized construction activities’ sector had the largest proportion and number of female workers with high exposure (62%, 2073 women).
Table 2
Proportion and number of exposed female workers according to activity sector in 2017 as per the ISICS and NACE industrial category classifications. a [SI=senstivity interval.]
a Example of how to read this table: In ISIC 8411, 1.7% of female workers are exposed to silica (14 520). Among them, 1% are exposed to a level >0.1 mg/m3. b High exposure among those exposed is >0.1 mg/m3 (the French 8-hour TWA-OEL).
Table 3 presents the distribution of exposed workers (men and women together) in 2017 by exposure level. Around 14% of exposed workers had a level of exposure <0.01 mg/m3 (a tenth of the TWA OEL) and 36% have a level of exposure >0.1 mg/m3.
Table 3
Distribution of the exposed workers by exposure level (2017).
a Calculated using mid-point values for the intensity and the frequency of exposure
Discussion
After a decreasing trend until the beginning of the 2000s, the proportion of workers exposed to silica dust in France remained stable at 4% from 2007 to 2017, representing 975 000 people in 2017. The decrease observed between 1982 and 1999 was the consequence of two factors. Firstly, with the establishment of the 1983 and 1997 French OEL regulations, work situations and technical operations changed and, therefore, the intensity, frequency and probability of exposure assessed in the JEM decreased over the period. Secondly, exposure declined as a result of structural change over the studied years in French industry, particularly mines and many industrial activities ceased operations, and as a result there was a large decrease in jobs at risk of exposure. After 2000, the proportion of exposed workers remained stable because there were fewer regulatory and technical changes, and the employment structure of the French workforce remained stable, especially within the construction industry.
Our results for France can be compared to those for other countries. A Finnish study using a similar method and the FINJEM matrix for exposure assessment found that the proportion of workers exposed to silica dust remained stable at 2.2% from 1990 to 2020 [versus 3.8% (3.5–4.1) in our population in 2017] (22). A Swedish study using JEM for exposure assessment also found that the proportion of exposed workers remained stable in Sweden since 2000 (around 3% of exposed workers) (23). A European study published in 2017 estimated that 3–5 million European workers were exposed to silica dust, and the construction industry was the sector with the highest proportion of exposed workers (18.9%) (24). We found similar results, with 38% of workers in this sector exposed (data not shown).
Using both expert knowledge and measurements to assess exposure, a UK study estimated that 590 000 workers were exposed to silica dust between 1990 and 1993 (25), representing 2.3% of the active working population in 1991 (26) (versus 1 000 000 in our study, representing 5% of the French working population). The occupations and industrial sectors mostly concerned by exposure in that study reflect our findings: construction, glass production, ceramic production, and metalworking. Another European study showed that the exposure level decreased from 0.013 to 0.010 mg/m3 in Europe between 2000 and 2015, except during the economic crisis of 2008 (27). In our study, the proportion of workers with high exposure also decreased over our study period (1982–2017). An OSHA study estimated that 73 300 American workers were exposed to a level >0.1 mg/m3 (twice the recommended OEL in USA) in 2014; this represented <0.1% of the working population in the USA in 2014 (28). In our study, the relative proportion was 1.2%, with exposure primarily in the construction industry. In Canada, an estimated 429 000 workers were exposed in 2016; of these, the vast majority were male workers (94%), which reflects our finding (93%) (29). In Australia, the proportion of exposed workers in 2011 was 6.6%; over half (3.7%) of these had high exposure (ie, >0.1 mg/m3) (30).
Exposure assessment
Some occupational exposures could not be assessed with the silica-JEM as certain job classifications did not always allow specific jobs to be identified, and some jobs had a very low exposure probability or frequency. This was particularly the case for silica dust exposure in agriculture occupations and sectors where the level and probability/frequency of exposure depends on (i) the proportion of silica in the soil and (ii) the type of crop grown (as soil sand content differs for different crops). Available data and the three indices we used (ie, probability, frequency, and intensity) did not allow us to assess a mean level of exposure for agricultural workers, despite exposure being possible during the soil preparation for some crops. Another example is the work of kitchen fitters who cut artificial stone; although the ANSES report (9) indicated that this occupation is one of several new contexts for occupational exposure to silica dust, it could not be identified in the classification we used. It must also be underlined that the production and cutting processes of artificial stone is not an industrial sector in France.
The calculation of the exposure level allows to have a better view of the 8-hour exposure. Some jobs can have a high intensity of exposure due to a task with high exposure, but they might do the task rarely. On the contrary, some can have task with low intensity of exposure, but do it frequently. In this case, their exposure level will be similar.
As presented previously, it was not possible to distinguish exposure from the task versus exposure from the surrounding environment. However, the contribution of the surrounding environment can be important in some industries such as the construction industry (31).
The accuracy of the silica-JEM depends on the occupation and industrial sector classifications used to build it, and because of this it has certain limitations related to the coding of jobs. More specifically, classification codes sometimes group occupations or industries that are heterogeneous in nature and have potentially different exposure risks; these differences make it necessary to define an average exposure for a single code.
In the present study, we used the center values for the classes for the three exposure indices (probability, frequency, and intensity) provided by the silica-JEM to estimate the exposure proportion. Because of this, the results presented in this article are subject to uncertainty; however, this uncertainty is partially mitigated by the SI, which we calculated by taking the lower and upper bounds of each probability class.
Despite their limitations, JEM are still the most suitable tools for assessing exposure in large populations where individual exposure assessment is not possible. The various Matgéné JEM give an historical assessment of exposure to different substances for all occupations and industrial sectors in France.
The indicators we estimated using the silica-JEM provide a detailed description of occupational exposure to silica dust in France in 2017 and the trend in this exposure over the previous 40 years (ie, 1982–2017). In a few years, it will be possible to see whether the 2021 French regulation on silica dust, which classified work involving exposure to silica dust generated by a work process as carcinogenic, has an impact on the proportion of exposed workers. To do this, the silica-JEM will have to be updated.
The indicators we estimated for five time points over several decades using the silica-JEM allowed us to calculate the approximate attributable risk fraction (ARF) to occupational exposure for diseases caused by silica dust. In 2017, 1.1–3% (322–912 cases) of lung cancer cases among men in France and 0–0.1% (6–18 cases) among women, were attributable to occupational exposure to silica dust (32). The total burden of disease is underestimated as the study focused only on cancers and did not include non-malignant respiratory diseases.
Although primarily linked to coal mining and silicosis in the past, silica dust still constitutes an occupational health concern today for many workers in various professional sectors. While work involving exposure to silica dust generated by a work process is now classified as carcinogenic, substituting this substance is difficult, especially for some industry processes such as concrete production. Moreover, it is already present in construction materials used in buildings built to date. Accordingly, France’s 2021 classification, labelling and packaging regulation concerns more the monitoring of exposure than the (essentially impossible) substitution of existing materials. However, according to the French regulation on carcinogenic agents, if the substitution is impossible, other protections must be set up such as limitation of the exposure (working with a wet process), or use of materials with lower silica rate, etc. The Matgéné JEM program actively takes part in the surveillance of the evolution of exposure to silica dust in France by estimating the number of workers currently and formerly exposed in previous decades as well as the industries and occupations concerned.