

Maintaining workforce productivity is critical for economies and employers globally. Yet, health problems (eg, chronic diseases, mental health conditions, and long COVID-19) cause significant productivity losses (1). Health-related productivity losses can arise from two interrelated phenomena: absenteeism and presenteeism (2).
Health-related absenteeism refers to the absence of employees from work because of health complaints (eg, physical or mental disability) (3). In high-income countries, health-related absenteeism contributes to lost productivity and significant costs. In the United States, 3.3% of full-time workers reduced their hours for health reasons in 2022—the second-highest rate since 1976 (4). In the European Union, health-related absences represent up to 4% of gross domestic product annually (5). Consequently, companies, health insurers, and taxpayers face substantial financial losses, amounting to several billions per year (6).
The rise in health-related absenteeism is driven partly by increasing mental health challenges, emotional exhaustion, and stress-related disorders, now recognized as leading contributors to work disability (6). Additionally, digitalization, infection risks, and social isolation—exacerbated by the COVID-19 pandemic—have intensified physical and psychological pressures on employees (7).
Compounding these challenges, many industries face skilled labor shortages due to an aging population and evolving skill demands, making it harder to replace absent employees. This results in operational bottlenecks and potential declines in service quality (3), creating both short-term productivity losses and long-term challenges in building a resilient, competitive workforce.
Health-related presenteeism refers to the phenomenon where employees continue to work despite being ill or otherwise impaired, often leading to diminished health-related productivity (1). Evidence suggests that the overall productivity loss attributable to presenteeism may surpass that caused by absenteeism. For instance, Li et al (8) estimated that ~40% of the total costs associated with arthritis stem from presenteeism, compared to only ~10% from reduced working hours linked to absenteeism. Similarly, van den Heuvel et al (2) reported that, among individuals with upper extremity disorders, most productivity losses were due to sickness presenteeism (57–89%). Despite its relevance, presenteeism remains difficult to measure, which has likely contributed to its relative underrepresentation in the scientific literature compared to absenteeism (1).
As companies strive to maintain productivity performance, occupational health interventions (OHI) have emerged as a critical strategy for mitigating health issues (9). They are increasingly adopted in clinical, corporate, and governmental settings to improve workforce well-being, reduce absenteeism, presenteeism, and generate economic returns. International organizations, including the World Health Organization (WHO) and the International Labor Organization, have advocated for integrated workplace health programs as part of preventive health strategies (10, 11). However, despite the increasing prioritization of OHI, persistently high absenteeism/presenteeism rates raise the question of which OHI are truly effective for companies and their employees.
Existing reviews often aggregate heterogenous outcome variables (eg, presenteeism, absenteeism, cost savings) or focus narrowly on intervention types, limiting cross intervention comparison (12). Methodological limitations, including small sample sizes and inconsistent designs, have further contributed to inconclusive findings (13). While several reviews examine health-related outcomes (eg, weight loss, stress reduction, improved cardiovascular markers), few have systematically assessed how OHI impact company economics, leaving a critical gap in understanding productivity-related effects. Lastly, OHI are evolving with new technologies and emerging health concerns, leaving earlier syntheses outdated (14).
To address these limitations, the present review systematically compared OHI domains across health-related absenteeism and economic outcomes to identify where interventions yield the greatest value. Our study aimed to assess the effectiveness of OHI in reducing sick-days and creating a positive return on investment (ROI), which is defined as the financial benefit obtained relative to the cost of implementing OHI. Benefits include savings from reduced absenteeism (ie, avoided wage costs for missed workdays) and gains from reduced presenteeism (ie, recovered productivity among employees working while unwell) (15, 16). Thus, a positive ROI reflects not only fewer absences but also improved productivity of employees who perform below their full capacity due to reduced energy, concentration, or work quality (17, 18).
Given rising concerns over mental health, physical inactivity, and workplace atmosphere, which were intensified by the COVID-19 pandemic, this review prioritized OHI targeting those areas. Mental health interventions use problem-solving or stress management programs, while physical health interventions focus on exercise or ergonomics. Workplace atmosphere interventions involve organizational strategies like workshops or team-based communication training to improve communication, teamwork, and psychosocial conditions (19). While safety interventions remain vital, they were excluded from this review as they are typically mandated by national, industry, or company-level regulatory frameworks (eg, the US Occupational Safety and Health Act, the EU Directive 89/391/EEC) and aim to reduce hazards or accidents. Such interventions differ conceptually from voluntary OHI that target behavioral or organizational health improvements, are more flexible in their design choices, and thus limiting comparability.
Methods
This systematic review and meta-analysis followed the PRISMA 2020 guidelines (20) and was prospectively registered with INPLASY on 15 November 2024 (registration number: 2024110066), two weeks prior to the start of data collection.
Search strategy and study selection
Studies were included if they met the following criteria: (i) primary quantitative research published in peer-reviewed journals; (ii) experimental, quasi-experimental, observational, or modelling design; (iii) focus on OHI targeting mental health, physical health, nutrition, or workplace atmosphere; (iv) conducted in Organisation for Economic Cooperation and Development (OECD) countries; (v) reported changes in sickness absenteeism or ROI; (vi) involved adult working populations (≥18 years); and (vii) published in English or German between January 2004 and November 2024.
Studies related exclusively to safety, not conducted in workplace settings, or without quantifiable outcomes were excluded. A structured search was performed in PubMed and Web of Science in December 2024 using Boolean operators, tailored to each intervention and outcome type. Full search strings are provided in Illustration 1 of the supplementary material (www.sjweh.fi/article/4265). An unsystematic literature search using Google Scholar supplemented this process to identify gaps missed by structured database searches. Studies from the unsystematic search were directly checked for duplication and verified against the inclusion criteria. Grey literature (eg, dissertations, conference abstracts, organizational reports, preprints, news releases) were not systematically screened.
Study screening and data collection
Inclusion criteria were applied sequentially as knockout filters. Two independent reviewers screened records using Rayyan software (Rayyan Systems, Inc) (21). Inter-rater reliability was substantial for title and abstract screening (Cohen’s κ=0.66) and almost perfect for full-text screening (Cohen’s κ=0.83). Disagreements were resolved through consensus or by a third reviewer.
Data extraction followed an expanded PICO (Population, Intervention, Comparator, Outcome) framework and included population details, OHI characteristics (eg, type, duration, delivery format), study parameters (eg, sample size, comparators), and outcome data (eg, sick days, ROI ratio). Following Cochrane recommendations, two reviewers jointly extracted effect size data for meta-analysis (22). When several publications utilized the same dataset, we treated each independently in the meta-analyses but counted each set once for overarching descriptives (eg, total participants, mean age, female ratio) to avoid double-counting. Details on data extraction parameters can be found in supplementary table S1.
Risk of bias assessment following the Joanna Briggs Institute (JBI)
The latest JBI critical appraisal checklists endorsed by Cochrane were used to assess risk of bias (22). Papers were evaluated using the appropriate checklist based on their study type (ie, RCT, quasi-experimental, and cohort study). Studies with an economic outcome underwent an additional assessment using the JBI Economic Evaluations Checklist, implying that ROI-focused studies received two JBI based appraisals.
The checklists were modified by removing two questions on treatment blinding and group equivalence given their impracticality in real-world workplace settings. Two researchers were involved in the risk of bias assessments, with disagreements resolved through consensus. The exact methodology for each appraisal tool is presented in supplementary table S2.
In line with previous research (23), studies were categorized according to the JBI rating as low (>0.7), moderate (0.5–0.7), or high risk of bias (<0.5). Only low-risk studies were included in the primary meta-analysis; others were retained for subgroup analysis.
Calculation of meta-effects
Meta-analytic synthesis was conducted using random-effects models implemented in R (version 4.4.1). For absenteeism outcomes, mean differences in sick days between intervention and control groups were extracted directly or derived from study data. When reported for periods other than 12 months, results were standardized using linear time-scaling. Confidence intervals (CI) for studies with differing timeframes were adjusted by scaling the standard error (SE) proportionally to the square root of the ratio between the new and original periods:
where μ represents the estimate’s mean, Z the Z-score for the desired confidence level, and SEt the standard error. T and t refer to the target and original time periods, respectively. The factor
ROI values were retained in reported timeframes to avoid time-scaling bias. Studies without CI reporting or alternative outcome measures (eg, departmental-level absenteeism or cost-effectiveness ratios) were excluded due to non-comparability but remain part of the discussion.
Between-study variance τ2 was estimated using the restricted maximum likelihood (REML) method (24), which is robust for meta-analyses with varying heterogeneity and study sizes (25). When REML produced excessive weight concentration in a small number of studies, we instead applied the Sidik-Jonkman (SJ) method. The SJ method was preferred in these cases because it is less sensitive to very small within-study variance, limits undue influences of single studies, and distributes weights more evenly across studies. The choice of the method was made after inspecting the weights.
We conducted sensitivity analyses, including funnel plots and leave-one-out analyses, for both primary (JBI rating >0.7) and extended analyses (all studies) on sick days and ROI. Due to few studies, results should be interpreted cautiously. Subgroup analyses were conducted based on intervention domain and type, industry, and delivery format to compare relative effectiveness and economic efficiency.
Results
Included studies and characteristics
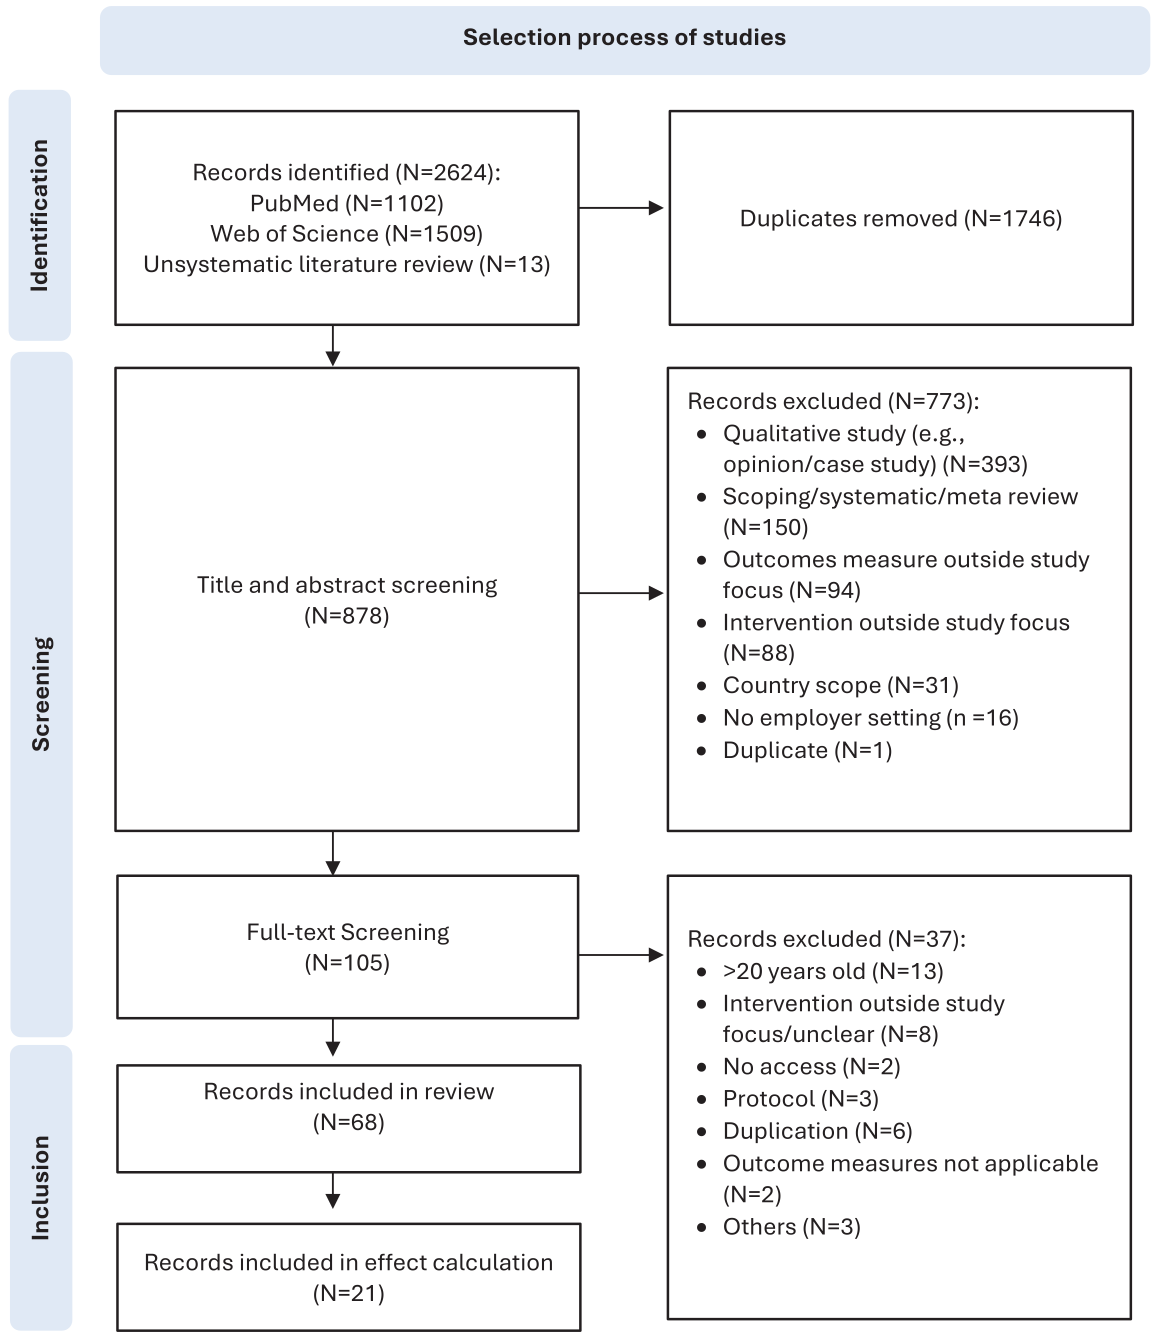
The PRISMA flow diagram (figure 1) illustrates the study selection process. After screening 2624 records, 68 studies met the inclusion criteria (26–93) (table 1). Detailed search data by intervention type, outcome measure, and database can be extracted from supplementary figure S1, and the full-text screening decisions in supplementary table S3.
Table 1
Summary characteristics of papers included in the review (N=68). More detailed study vignettes can be investigated in table 4 of the supplementary material. [N/A=not available; Quasi-E=quasi experiment; RCT=randomized control trial; ROI=return on investment.]
| Reference 1 | Study design (size) | Study population | Intervention | Control | Outcome 2 | Delivery format 3 | Country scope |
|---|---|---|---|---|---|---|---|
| Akerstrom et al (26) | Quasi-E (N=N/A) | Public sector employees, ~85% in healthcare | 24-month stress intervention led by line managers and Human Resources, focused on task redesign | Reference data from 247 matched workplace groups | Sickness absence rate | Phone, In-person | Sweden |
| Arends et al (27) | RCT (N=158) | Employees (18–63) with Common Mental Disorders at start of sick leave | Problem-solving by occupational physicians (2–5 consults) following SHARP-at-work model | Single consultation per Dutch occupational guidelines | Recurrent sick leave (incidence/time) | In-person | Netherlands |
| Baker et al (28) | Quasi-E (N=890) | US employees with obesity or comorbid conditions | Weight loss and health improvement program (up to 48 sessions and health tracker/tools) | No comparator | ROI | Phone, Digital | USA |
| Blake et al (29) | Quasi-E (N=1452) | National Health Service (NHS) hospital staff | 5-year wellness program including health campaigns, fitness, and relaxation | No comparator | Sickness absence rate | Digital, In-person | UK |
| Blangsted et al (30) | RCT (N=616) | Danish office workers | Resistance training and general physical exercise with contracts and trainer visits | No additional physical activity | Sick days; sickness absence rate | In-person | Denmark |
| Bondar et al (31) | Quasi-E (N=1,132) | US employees with moderate anxiety or depression | Digital mental health program (screening, self-help, care access) | No comparator | ROI | Digital, In-person | USA |
| Braun et al (32) | Quasi-E (N=N/A) | UK employees in Better Health at Work Award program | Tiered health program focusing on workplace improvements and health promotion (e.g., nutrition) | No comparator | Sick days; cost-benefit | Not provided | UK |
| Brox & Frøystein (33) | RCT (N=129) | Norwegian care home staff | Weekly light aerobic group exercise and optional stress/nutrition education | No intervention | Sick days | In-person | Norway |
| De Boer et al (34)* | RCT (N=116) | Employees >50 years, reporting inability to work until retirement | Occupational health program: 3+ consultations, action plan, referrals as needed | Care as usual (access to doctor, no invite to consult) | Sick days | In-person | Netherlands |
| Dement et al (35) * | Cohort (N=10,432) | University hospital staff | Long-term workplace health program including assessments, coaching, wellness access | No program participation | ROI | Digital, Phone, In-person | USA |
| Duijts et al (36) | RCT (N=151) | Employees at high risk of sickness absence due to psychosocial health (not on leave) | Preventive coaching (7–9 sessions over 4.5 months) led by trained coaches | Care as usual (e.g. social worker or company doctor counselling if needed) | Sick days | In-person | Netherlands |
| Ebert et al (37)* | RCT (N=264) | German employees with high stress (PSS-10 ≥22) | 2.5-month digital stress management training with e-coach focused on problem-solving and emotion regulation | Waitlist control with care as usual | ROI; net benefit; cost-effectiveness ratio; cost-benefit ratio | Digital | Germany |
| Elson et al (38) | Modeling (N=1,984) | Education department employees in South Australia | Employee Assistance Program with 6 counseling sessions | No comparator | Cost-benefit ratio | Digital, Phone, In-person | Australia |
| Framke et al (39)* | RCT (N=2,576) | Preschool staff in 78 Danish schools | 25-month participatory work climate intervention (consisting of 4 phases) | Staff in 34 preschools with no intervention | Sick days | In-person | Denmark |
| Freund et al (40)* | RCT (N=396) | German employees | Digital stress program with modules on psychoeducation, problem-solving, emotion regulation, and future planning | Waitlist control | ROI; net benefit; cost-benefit analysis; cost-effectiveness ratio; cost-utility | Digital | Germany |
| Geraedts et al (41) | RCT (N=231) | Dutch employees with depressive symptoms | 6-week guided online self-help combining cognitive behavioral therapy and problem-solving (weekly lessons) | Care as usual | ROI; net benefit; cost-benefit ratio; cost-effectiveness ratio; cost-utility | Digital | Netherlands |
| Goetzel et al (42) | Quasi-E (N=2,458) | Employees from small businesses in Colorado | Health Risk Management program, including annual health assessments, action reports, coaching, self-learning | No comparator | ROI | Digital, Phone, In-person | USA |
| Gregson et al (43) | Quasi-E (N=80) | Danish hospital staff | 3-month fitness training (2×30min/week) | Non-participants in same unit | Sickness absence hours | In-person | Denmark |
| Groeneveld et al (44) | RCT (N=573) | Construction workers with cardiovascular disease risk | Lifestyle intervention including coaching (face and phone) and brochures on activity, diet, and cardiovascular disease | Care as usual | Cost savings | In-person, Phone | Netherlands |
| Gubler et al* (45) | Quasi-E (N=111) | US industrial laundry workers | Free wellness program with biometric screenings, reports, seminars, insurance discount | Employees at other site | ROI | In-person | USA |
| Hendriksen et al (46) | Quasi-E (N=433) | Office staff at Dutch insurance company | 5-month multilevel program including leadership training and health coaching | No comparator | Sickness absence rate | Digital, Phone, In-person | Netherlands |
| Hengel et al (47) | RCT (N=293) | Construction workers from 15 departments of 6 Dutch companies | Physical training and empowerment sessions (6 months) | No intervention | Sick days (dichotomized) | In-person | Netherlands |
| Hengel et al* (48) | RCT (N=293) | Construction workers from 6 Dutch companies | 6-month physical and mental training at worksites | Mandatory safety training only | Sick days; ROI | In-person | Netherlands |
| Herman et al (49) | RCT (N=70) | Workers with chronic low back pain | Naturopathic treatment incl. acupuncture, physical exercise, nutrition | Standardized physiotherapy education and a brochure | ROI | In-person | Not provided |
| Hughes et al (50) | Quasi-E (N=516) | Overweight employees in three US Fortune 500 companies | Employer-led weight management with physical activity, diet, medical monitoring | No comparator | Sick days | In-person | USA |
| Iijima et al (51) | Quasi-E (N=12,864) | Employees from 11 Japanese companies | Tiered mental health prevention per national guidelines | Companies grouped by ROI | ROI; net benefit | Not provided | Japan |
| Ikegami et al (52) | Quasi-E (N=1,420) | Japanese manufacturing employees | Manager training in active listening and feedback session | Pre-intervention baseline | Sickness absence rate | In-person | Japan |
| Jenny et al (53) | Quasi-E (N=5,014) | Swiss employees from 8 diverse pilot companies | Multifaceted stress management incl. self-assessment, leadership training, and formation of collaborative groups | Non-participants in stress training program | ROI | Digital, In-person | Switzerland |
| Jorgensen et al (54) | RCT (N=363) | Danish cleaning staff | Physical coordination or cognitive behavioral training with group sessions | Health check with fitness test | Sick days | Phone | Denmark |
| Kapinos et al (55) | Cohort (N=20,251) | US employees at chronic disease risk | Health risk assessment (20 min) and tailored or intensified lifestyle coaching | No intervention | Cost savings | Digital, Phone, In-person | USA |
| Karlsson et al (56) | RCT (N=197) | Adults (18–59) on short-term sick leave for common mental disorders | Five-step problem-solving approach in 2–5 sessions | Care as usual (i.e., cognitive behavioral therapy or antidepressants) | Sick days | In-person, Phone | Sweden |
| Keus van de Poll et al (57) | RCT (N=100) | Employees with common mental disorders or stress symptoms | Occupational Health Service consultants with 1-day training in problem-solving; 3 follow-ups over three months | Occupational Health Service consultants with brief intro to psychosocial/mental health | Sick days | In-person | Sweden |
| Keus van de Poll et al * (58) | RCT (N=100) | Employees with common mental disorders or stress symptoms | Occupational Health Service consultants with 1-day training in problem-solving; 3 follow-ups over three months | Occupational Health Service consultants with brief intro to psychosocial/mental health | Net benefit; cost-benefit; cost-effectiveness ratio | In-person | Sweden |
| Klasen et al* (59) | RCT (N=139) | Employees at high risk of long-term sickness absence with mild depressive symptoms | Psychological treatment (problem-solving therapy and cognitive behavioral therapy; up to 13 sessions) | Care as usual on request | Sick days | In-person | Netherlands |
| Kobayashi et al (60) | Controlled trial (N=1,070) | Office workers in Japanese steel manufacturer (non-shift departments) | Participatory program to improve work environment using Mental Health Action Checklist | No intervention | Sick days (dichotomized) | In-person | Japan |
| Krampen et al (61) | RCT (N=56) | Public service employees selected for high absenteeism | 2-month systematic self-observation and reflection on health behavior (weekly meeting in small groups) | Waiting list control group | Sick days | In-person | Germany |
| Larsen et al* (62) | Quasi-E (N=405) | Danish nursing home staff | Health literacy training and structured manager-staff dialogues | Same employees but pre-intervention | Sick days | Not provided | Denmark |
| Lerner et al* (63) | RCT (N=253) | US veterans with work-restricting depression | “Be Well at Work” phone counseling and integrated care (IC) | IC without work counseling | ROI | Phone | USA |
| Linden et al (64) | Quasi-E (N=509) | Employees of German Federal Pension Insurance department | Health program including courses (nutrition, stress, fitness) and team focus groups | Departments not participating in the intervention | Sickness absence rate | In-person | Germany |
| Losina et al (65) | Cohort (N=292) | US office employees (insurance) | 6-month team-based physical activity challenge with financial incentives | Compared groups based on weekly activity levels | Sickness absence hours | Digital, In-person | USA |
| Makrides et al (66) | Cohort (N=402) | Public Service employees in Nova Scotia Department of Justice | Comprehensive wellness program including risk assessment, lifestyle coaching, workplace changes | No comparator | Sick days (dichotomized) | In-person, Phone, Digital | Canada |
| Meenan et al (67) | RCT (N=6,958) | Overweight hotel workers in Hawaii | 2-year weight loss program with assessments, feedback, support groups | Minimal intervention | Net present value | In-person | USA |
| Milani et al (68) | RCT (N=339) | Employees and spouses of one employer | 6-month wellness program Risk Assessment and Modification Program covering fitness, stress, and health access | Care as usual | ROI; cost savings | In-person | USA |
| Musich et al (69) | Quasi-E (N=24,651) | US Dell employees with insurance coverage | Health risk assessments, lifestyle coaching, disease management support | Non-participants | ROI; net benefit | Digital, Phone, In-person | USA |
| Noben et al* (70) | RCT (N=413) | Dutch hospital nurses at mental health risk | Mental health screening, referral and physician-led improvement protocol | Screening only | ROI; net benefit; cost-benefit assessment | Digital, In-person | Netherlands |
| Norwitz et al (71) | Quasi-E (N=9) | Employees with obesity, prediabetes, or diabetes | Ketogenic diet, virtual check-ins, glucose monitoring, app support | No comparator | Cost savings | Digital | USA |
| Ornek et al (72) | Quasi-E (N=70) | Turkish female textile workers with work-related stress | 45-minute sessions on stress management techniques, coping strategies, relaxation exercises (12 weeks) | Women at another factory | Sickness absence hours | Digital, Phone, In-person | Turkey |
| Proper et al (73) | RCT (N=299) | Dutch civil service office workers | Seven physical activity counselling sessions (20 min.) during working hours | General written health information | Cost-benefit assessment; cost-effectiveness ratio | In-person | Netherlands |
| Rantonen et al* (74) | Quasi-E (N=193) | Workers with lumbar spine pain | Rehab, physiotherapy, or counseling for 1–5 months | Care as usual | Sick days | In-person | Finland |
| Renaud et al (75) | Quasi-E (N=270) | Canadian financial sector employees | 3-year multi-module wellness program on stress management, heart health, nutrition, and physical activity | No comparator | Sickness absence rate | Phone, In-person | Canada |
| Robroek et al (76) | RCT (N=924) | Employees in Dutch healthcare/logistics/public sectors | Digital wellness program with counseling and online self-monitoring tools | Health check with personal advice and feedback via a website | Sickness absence rate | Digital, In-person | Netherlands |
| Ryan et al (77) | Pre-post design (N=1,400) | Australian hospital employees | Daily 6-min “take-a-break” group sessions on posture, relaxation, education | 3-year pre-program injury data | Sick days; cost savings | In-person | Australia |
| Saleh et al (78) | Quasi-E (N=151) | Rural US employees from six organizations | Health risk assessment and awareness; with/without lifestyle coaching | No intervention | Cost-effectiveness ratio | Not provided | USA |
| Song et al (79) | RCT (N=32 974) | US warehouse workers | Multi-component wellness program (12 modules on nutrition, exercise, stress reduction) | No intervention | Sickness absence rate | Not provided | USA |
| Stansfeld et al* (80) | RCT – pilot (N=350) | Staff and managers from NHS mental health services, excluding those on long-term sick leave | Guided e-learning on stress for managers (6 modules over 3 months) | Managers in another service with no intervention | Sick days | In-person | UK |
| Taimela et al (81) | RCT (N=382) | Workers with high risk of sickness absence | Nurse/physicians-led program including feedback on risk assessment, action plan, referrals | Contact on request, no feedback or consult | Sick days | In-person | Finland |
| Taimela et al (82) | RCT (N=382) | Employees at high risk of sickness absence (based on self-reported work ability, fatigue, etc.) | Nurse/physician-led feedback, consultation offer, action plan, referrals if needed | No feedback on health results; no invitation to consult; could request doctor/nurse contact | Sick days | In-person | Finland |
| Thiart et al* (83) | RCT (N=128) | Teachers with insomnia | Internet-based cognitive behavioral therapy for insomnia with weekly modules and e-coaching | Waitlist control | ROI; net benefit; cost-benefit ratio | Digital | Germany |
| Tveito & Eriksen (84) | RCT (N=40) | Nursing staff in a care home for the elderly | 9-month health program: exercise (1hr/week); lifestyle education, stress sessions (15hrs) | Delayed intervention after pre/post-tests | Sick days | In-person | Norway |
| van den Ven et al (85) | Quasi-E (N=176) | Hospital and manufacturing workers with low- socio-economic position | Preventive medical check-up and 6-month motivational interviewing (up to 7 sessions) | Preventive medical check-up only | Sick days (dichotomized) | Digital, In-person | Netherlands |
| van Dongen et al* (86) | RCT (N=730) | Older Dutch hospital employees | Vitality exercise including yoga session, unsupervised exercise training, and three coaching sessions | Written information about a healthy lifestyle | ROI; net benefit; benefit-cost ratio | In-person | Netherlands |
| van Dongen et al* (87) | RCT (N=412) | Office employees of a financial services provider | 9-min. motivational group interviews (3 sessions) and “VIP zones” to improve social and physical environments | Care as usual | ROI; net benefit; cost-effectiveness ratio; cost-benefit-ratio | Digital, In-person | Netherlands |
| van Holland et al (88) | RCT (N=303) | Meat processing workers (≥12 hrs/week) | Online questionnaire and personalized intervention recommendations (e.g., General practitioner or dietician visits) | Routine occupational healthcare and existing programs | ROI; net benefit; cost-benefit ratio | In-person, Digital | Netherlands |
| Viester et al* (89) | RCT (N=314) | Construction workers with prior health check-ups | 6-month health promotion program on activity and diet | Care as usual | Sick days | Phone, In-person | Netherlands |
| Von Thiele Schwarz et al (90) | Quasi-E (N=1311) | Public dental health employees | 12-month reduced work hours or physical exercise at work | No intervention | Sick days | In-person | Sweden |
| Vonderlin et al* (91) | Quasi-E (N=1830) | Managers and employees from 12 companies | 6-month mindfulness and leadership training for managers | No intervention | Sick days | In-person | Germany |
| Wijnen et al* (92) | Cohort study (N=303) | Healthcare workers, mainly carers | Digital platform helping to assess needs, select interventions, and evaluate effectiveness | Waitlist control | ROI; net benefit; cost benefit | Digital | Netherlands |
| Zetterberg et al* (93) | RCT (N=147) | Public sector workers with pain/stress-related illnesses (majority women) | “Effective Communication within the Organization” program: 2–3 hybrid group sessions (skill training, reflection) | Psychoeducation (2 lectures and brochures) | Sick days | Digital, In-person | Sweden |
1 Studies with stars are included in the meta effect calculation. 2 Only outcomes measures listed relevant for this review (eg, multiple studies record health related outcome measures which are not listed here). 3 Digital=web/app-based, phone=phone-based.
The studies represented ~160 000 participants with a mean age of 40.3 years and 45.5% female participation. Samples sizes within each study ranged from 9 (71) to 48 664 (79), with a mean of 2388. The majority were conducted in The Netherlands (26%), the United States (22%), Germany (9%), and Scandinavia (24%). The articles spanned various sectors: the majority studied healthcare settings (31%), including hospitals and long-term care, and industrial sectors (22%), such as metal and construction. OHI primarily targeted individual employees (90%), with fewer addressing leadership (19%), organizations (13%), or teams (7%). Interventions were mainly delivered in-person (79%), with digital (38%) and phone (25%) formats used less frequently. Hybrid methods combining in-person, phone, and digital approaches were used in 10% of studies. Delivery formats shifted over time, with digital and hybrid OHI increasing from 2015 onward. Recent years (2019–2024) saw a consistent increase in hybrid models (supplementary figure S2).
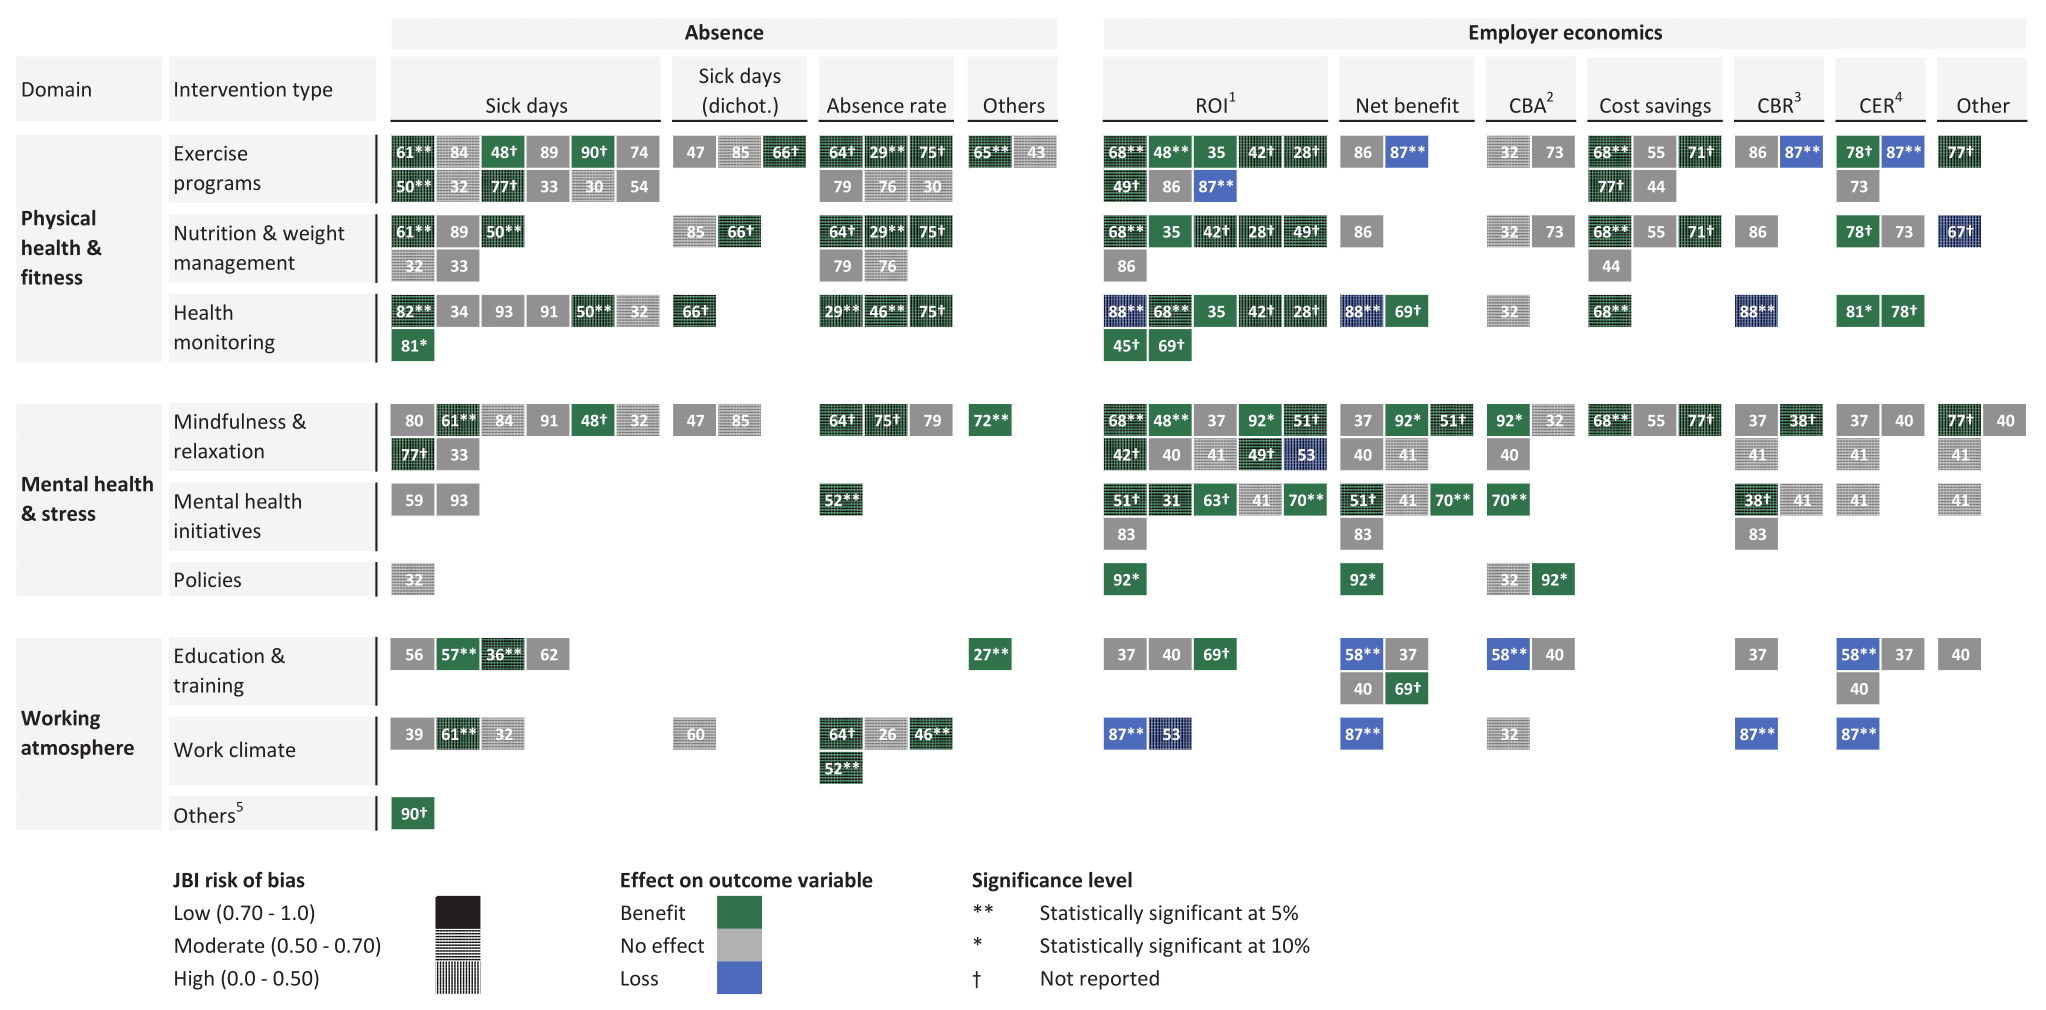
Interventions were categorized into three overarching OHI domains (figure 2) with 34% focusing on physical health and fitness, 16% on mental health, 13% on workplace atmosphere, and 37% covering multiple domains. Each domain included various intervention types. The most common being exercise programs (50%), mindfulness or relaxation (37%), and nutrition or weight management (35%). Regarding outcome variables, most of the included studies focused on the impact of OHI on sickness absenteeism (53%), followed by economic variables (43%), with a small proportion (4%) addressing both. .
Vignettes for each paper included in the review (N=68) and summary statistics can be found in supplementary tables S4 and S5.
Figure 2
Overview of study results and risk of bias for selected studies based on outcome measure and OHI domain. Note: Study numbers correspond to the reference number and numbering of Table 4 of the Supplement Material, with some studies appearing multiple times as they evaluate various interventions and outcomes. Shading pattern reflects the JBI rating: fully shaded for low (JBI>0.7), dotted for moderate (0.5–0.7), and striped for high risk of bias (<0.5). Colors indicate effect direction: black for benefits, dark gray for no effect, and light grey for negative outcomes. Non-significant results are classified as no effect. Stars indicate statistical significance levels reported for outcome variable in respective study. Crosses represent studies without reported significance levels. 1) Return on investment. 2) Cost-benefit analysis. 3) Cost-benefit ratio. 4) Cost-effectiveness ratio. 5) Eg, Reduced work hours
Risk of bias assessment
Of the 68 studies, 35 (51%) were classified as low, 19 (28%) as moderate, and 14 (21%) as high risk of bias. The most common biases in moderate-to-high-risk studies included missing statistical analyses (16 studies), no control group (15), and unreliable outcome measurements (14).
Of the 33 studies that underwent an economic evaluation appraisal, over 70% were rated as low risk of bias, while 9 (~27%) were classified as having moderate-to-high risk of bias. The main deficits for economic studies included missing information on generalizability (9 studies), insufficient intervention or comparator description (8 studies), and no sensitivity analyses (7 studies). The JBI critical appraisal results are presented in supplementary table S6.
OHI effects on absence and employer economics
Figure 2 provides an overview of the two primary outcome dimensions, absenteeism and employer economics, mapped to their respective interventions, risk of bias assessment, and statistical effect.
Approximately 25% of studies reported a statistically significant positive effect. Among these, around three-quarters focused on absences, while the remaining addressed economic outcomes. The strongest individual effects among low-risk studies were observed in a stress intervention by van de Poll et al (57) reducing absenteeism by 15 days annually, and a mental health program for nurses by Noben et al (70), reporting an ROI of €11 per euro invested.
Negative effects were found in only 5% of studies, all related to ROI. The study with the largest loss (€6.66 per euro invested) was conducted by van Dongen et al (87), targeting the social and physical work environment of office employees in a financial services organization. Notably, 90% of the studies indicated a positive trend for either sickness-related or economic outcomes. A summary by sector (healthcare, industrial, consumer services) is provided in supplementary figure S3.
Meta-analyses
Meta-analyses were performed to assess the effect of OHI on sick days and ROI.
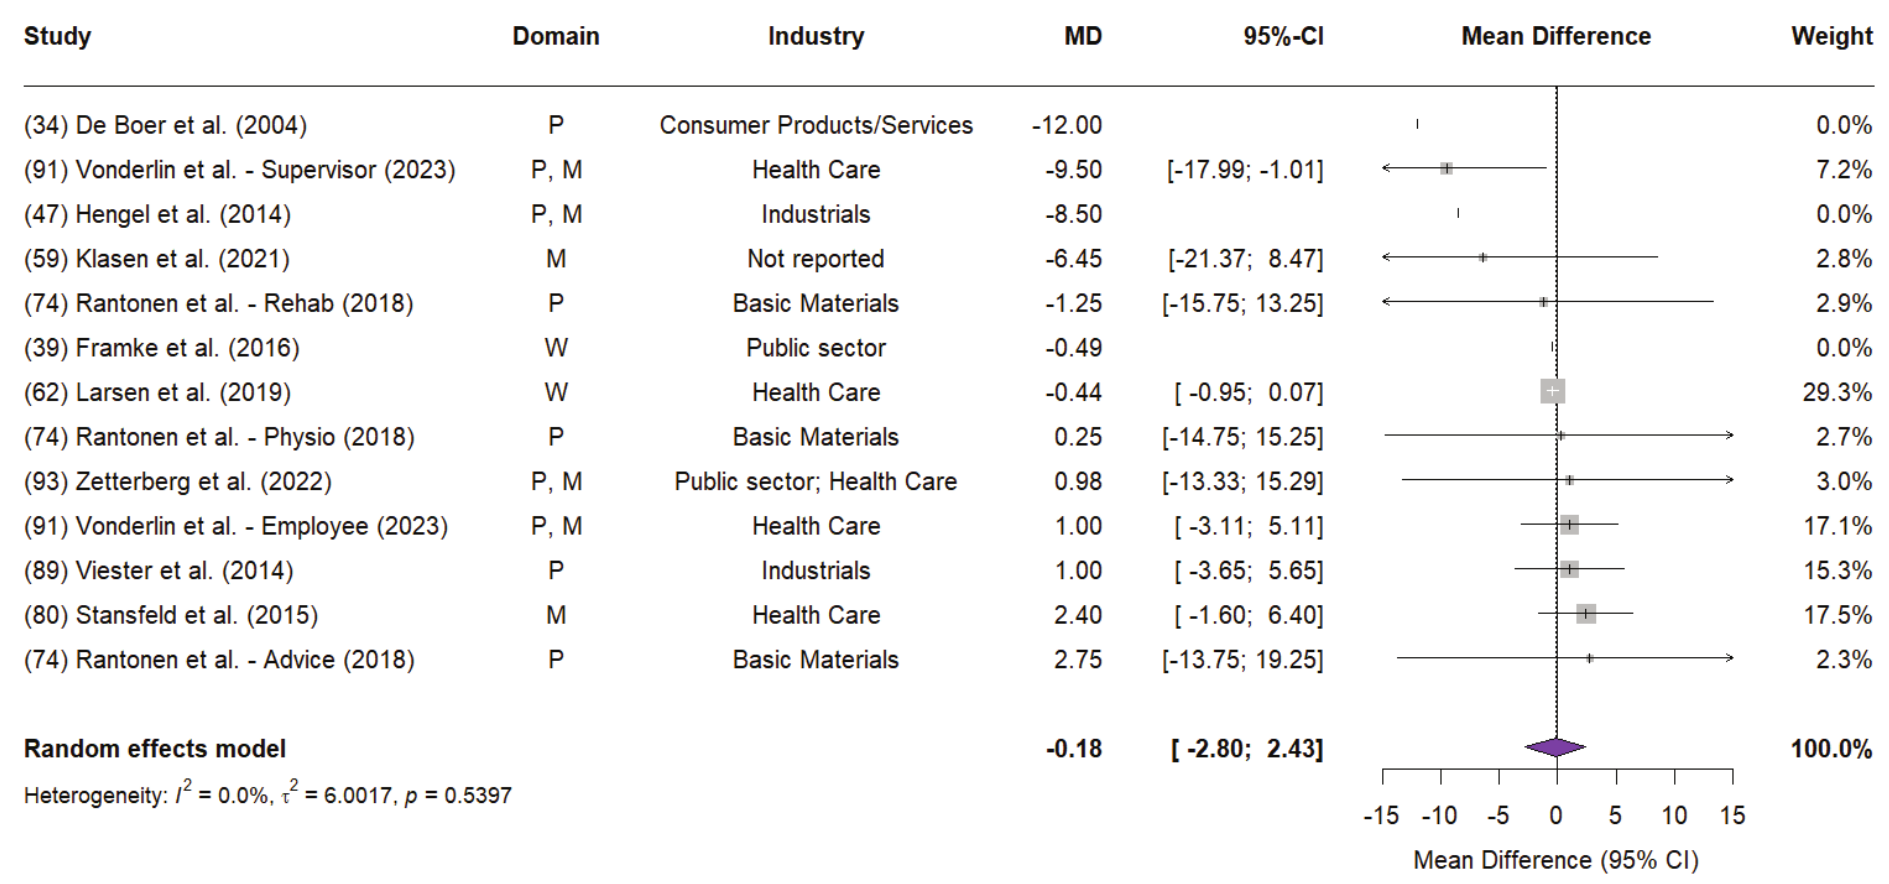
Meta-analyses of sick days for low risk of bias studies. Using REML estimation, OHI were associated with a non-significant mean reduction of -0.39 sick days per employee annually (95% CI -0.89–0.10; P=0.121), with low heterogeneity and between-study variance (I2=0.00%; τ2=0.00). Yet, the results are primarily driven by Larsen et al (62), which accounted for 95% of the weight in the random-effects model (supplementary figure S4). This study reported a general reduction in sick days of -0.44 (95% CI -0.95–0.07) scaled up from an original six-month period.
To correct for the excessive weight of the study, a follow-up analysis using the SJ method for heterogeneity estimation was conducted (figure 3). The SJ method yielded a mean difference of -0.18 days (95% CI -2.80–2.43; P=0.890), with a wider CI than the REML model. The heterogeneity and between-study variance estimates remained low (I2=0.00%; τ2=6.00). The distribution of study weights was more balanced in the SJ model, reducing the dominance of Larsen et al (62), which accounted for 29.3% of the total weight compared to 95% under REML. Despite this adjustment, the overall findings remain statistically non-significant.
Figure 3
Random-effects model (SJ method) for mean differences = in sick days in low risk of bias studies (JBI > 0.7) Note: Study numbers correspond to reference number and numbering of Table 4 of the Supplement Material. For the intervention domain, the following abbreviations apply: P=Physical health and fitness; M=Mental health and stress; W=Education and training. Studies that did not report statistical results for the mean difference in sick days were excluded from the random-effects calculation (assigned a weight of 0%) and are displayed for reference purposes only. Some studies report sick day results for specific sub-groups (eg, Vonderlin et al. (91), hence they appear multiple times in the forest plot with the respective subgroup designation. The P value at the lower end of the forest diagram refers to the heterogeneity test.
Including all studies regardless of risk of bias increased heterogeneity and between-study variance substantially (I2=96.1%; τ2=105.11). Sick days were reduced to -3.99 (95% CI -10.18–2.21; P=0.207), but results were notably influenced by one high risk of bias outlier [ie, Krampen et al (61)]. The variability in mean differences ranges from -32.4–8.06 sick days.
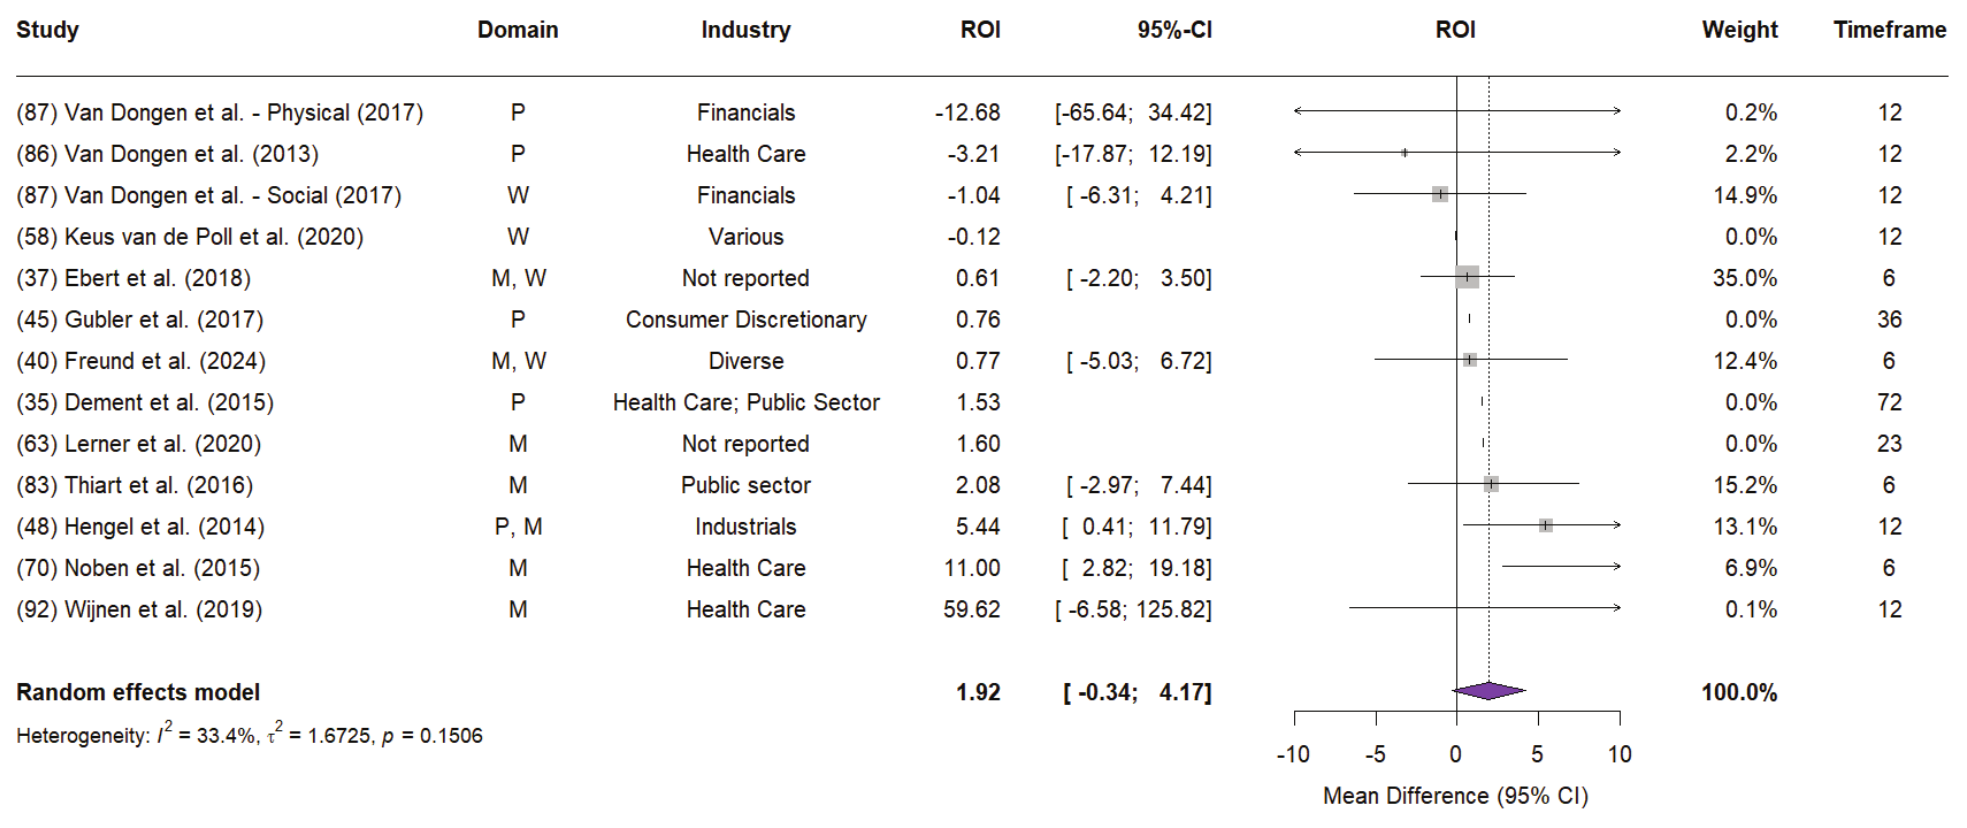
Meta-analyses of ROI for low risk of bias studies. The random-effects model for ROI outcomes in low risk of bias studies yielded an ROI of 1.92 (95% CI -0.34–4.17; P=0.096), with moderate heterogeneity (I2=33.4%; τ2=1.67) (figure 4). The most precise study, a randomized controlled trial (N=264) by Ebert et al (37) on a digital stress management program, reported an ROI of €0.61 per euro invested over six months. Its modest effect size was offset by high model weight from narrow confidence intervals. ROI estimates ranged widely, with van Dongen et al (87) reporting -€12.68, and Wijnen et al (92) reporting €59.62, driven by €2981 in productivity gains per employee. Due to wide CI, both studies received relatively low weight in the random-effects model.
Figure 4
Random-effects model (REML method) for ROI point estimate from low risk of bias studies (JBI>0.7) Note: Study numbers correspond to reference number and numbering of Table 4 of the Supplement Material. For the intervention domain, the following abbreviations apply: P=Physical health and fitness; M=Mental health and stress; W=Education and training. Studies that did not report statistical results for the ROI point estimate were excluded from the random-effects calculation (assigned a weight of 0%) and are displayed for reference purposes only. Timeframe indicates the horizon over which the ROI was calculated. The P value at the lower end of the forest diagram refers to the heterogeneity test.
When including all studies regardless of risk of bias ROI estimate decreased to 1.05 (95% CI- 2.21–4.30; P=0.529), mainly driven by Geraedts et al (41) and van Holland et al (88), both with moderate and high risk of bias. Heterogeneity increased substantially (I2=74.00%; τ2=14.22).
Funnel plots for low-risk of bias studies appeared broadly symmetrical for both sick days and ROI outcomes, though interpretations should be cautious due to the small number of studies. Leave-one-out analyses showed robust findings, with no single study substantially altering the primary meta-analyses.
Subgroup analysis. All subgroup analyses were restricted to studies with a low risk of bias and conducted by intervention domain, intervention type, industry, and delivery format. Due to small sample sizes and lack of significant results in some subgroups, the following analyses are exploratory and require further validation.
A closer examination of the intervention domains and types driving economic effectiveness reveals that mental health and stress interventions (k=7 studies) show a statistically significant positive impact on ROI, with a point estimate of 2.99 (95% CI 0.02–5.96; P=0.049; I2=50.00%; τ2=4.50), providing evidence of an economic benefit. In contrast, the effect on absenteeism (k=6) was inconclusive (mean difference -1.02; 95% CI -5.70–3.67; P=0.579; I2=43.60%; τ2=13.16). Over 85% of intervention types contained fewer than four studies. Hence, no other intervention domains or types showed significant effects on sickness absenteeism or ROI, with most exhibiting substantial heterogeneity.
Subgroup analyses by industry showed no statistically significant effects on absenteeism. In healthcare (k=4) the ROI showed a non-significant positive effect of 7.49 (95% CI -6.27–21.24; P=0.144; I2=59.80%; τ2=68.59). Other industries had minimal or no available data, limiting meaningful comparisons.
Lastly, subgroup analysis by delivery format revealed no statistically significant effects on absenteeism or ROI. In-person interventions (k=3) showed the highest ROI (4.03; 95% CI -2.24–10.29; P=0.074; I2=10.10%; τ2=3.79), while digital-only interventions (k=4) showed lower and more uncertain ROI values (0.99; 95% CI -1.31–3.29; P=0.264; I2=7.80%; τ2=<0.01). Full estimates of the subgroup analyses are reported in supplemtnary figure S6.
Heterogeneity across studies. Meta-analyses of low-risk studies showed low heterogeneity, but including all studies increased heterogeneity significantly (I2=96.10% for sick days, I2=74.00% for ROI), mainly due to outliers like Krampen (61). Adding the study by Krampen to the low-risk group raised heterogeneity to I2=96.9%. Heterogeneity also changed in other subgroup analyses. Mental health and stress interventions had the highest variability (I2=43.60% for sick days; I2=50.00% for ROI). Healthcare industry studies also showed significant heterogeneity (I2=41.20% for sick days; I2=59.80% for ROI), likely due to diverse organizational settings and workforce structures.
Discussion
This study examined whether OHI reduce sickness absenteeism and generate economic returns. Most prior reviews have focused narrowly on specific intervention domains or workforce subgroups (17, 94–96), limiting cross-domain comparisons. This review is among the first to systematically evaluate and compare the effectiveness of major OHI domains across both absenteeism and ROI outcomes.
Meta-analysis using the SJ method yielded a mean difference in absenteeism of -0.18 days (95% CI -2.80–2.43; P=0.890), indicating no measurable effect. The pooled ROI was 1.92 (95% CI -0.34–4.17; P=0.096), indicating a tendency for an economic benefit. However, the CI points to uncertainty around the estimate. At the same time, the upper bound of the interval suggests that, if effective, OHI may yield substantial economic returns.
Mental health and stress interventions were the only domain with a statistically significant ROI.
Although our analysis did not show a statistically significant reduction in sick days, multiple studies within our sample demonstrated significant effects. Van de Poll et al (57) reported a 15-day reduction in sick leave over 12 months, Hughes et al (50) observed a drop in self-reported sick days from 3.1 to 1.1 within 3 months, and Ornek & Esin (72) found significant decreases in absenteeism duration alongside enhanced job performance. Authors argue effects were often fueled by adequate resource provision (both monetary and non-monetary), strong managerial involvement, active employee participation, clear communication, and an open feedback culture.
The economic advantage of mental health interventions aligns with prior evidence linking improved presenteeism to reduced productivity loss from depression, anxiety, and chronic stress (97–99). Prior studies suggest that presenteeism may account for greater economic burden than absenteeism (100, 101), and interventions that improve mental health have shown consistent potential to offset these losses.
Findings should be interpreted in light of study quality and heterogeneity. While primary analyses showed low heterogeneity (I2=0% for sick days; 33% for ROI), some subgroups varied substantially. This heterogeneity arises, for instance, from differences in study design (eg, RCT versus quasi experimental), target populations (sick-listed, high-risk, or general employees), OHI level (individual, group or organizational), and outcome definitions (registry- versus self-reported absence).
Many of these parameters can be standardized to enhance comparability and quality. For instance, standards could specify the cost components included in ROI calculations or establish registry-based reporting (rather than self-reported data) as the preferred approach. With only half of our included studies rated with low risk of bias, developing and adopting these standards is essential.
Presenteeism: The hidden burden
The absence of measurable change in sickness absence does not necessarily imply that employees are maintaining their health level. Gradual changes, for example in presenteeism, often remain undetected; some surveys suggest up to ~80-90% of employees occasionally work while ill (102, 103). Habitual presenteeism can have serious implications for health systems, as it may prolong illness, delay recovery, and increase vulnerability to future health conditions, thereby consuming additional healthcare resources (104). We hypothesize that the positive ROI in combination with inconclusive effects for sick day reduction might capture potential gains in on-the-job productivity driven by a reduction in presenteeism (105). This explanation is theoretical as this study did not directly extract outcome indicators for presenteeism.
Several studies in our sample identified presenteeism as the primary driver of cost reductions and positive ROI. For example, Thiart et al (83) evaluated an internet-based cognitive behavioral therapy for insomnia and found that savings from reduced presenteeism (€540 per participant) far exceeded those from absenteeism (€78), resulting in an ROI of 208%. Similarly, Ebert et al (37) reported that the economic benefit of a digital stress-management program (ROI €0.61) was largely attributable to improvements in on-the-job productivity rather than reduced sick leave. Thus, including presenteeism metrics can substantially change the estimated economic value of OHI. Ignoring these productivity effects may underestimate the true benefits.
Including presenteeism costs in economic evaluations has become increasingly common despite debates about complexity and the heterogeneity of measurement (1, 106). In our sample, we identified three methods for estimating presenteeism effects: (i) quantifying lost workdays (eg, Osterhaus method) (37, 40, 70, 83, 92), (ii) assessing overall performance during working hours (eg, WHO Health and Work Performance Questionnaire [WHO-HPQ]) (48, 87), and (iii) evaluating health-related functional limitations (eg, Work Limitations Questionnaire [WLQ]) (63). Thus, comparing presenteeism effects across studies often remains challenging. For practice, this highlights the need for standardized measurement tools and reporting guidelines to enhance comparability across studies.
Barriers to effective OHI
Dissemination and implementation science emphasizes that the success of OHI depends not only on the intervention itself but also on how it is implemented and communicated within an organizational context. Thereby, implementation refers to the process of integrating OHI into the organization, while dissemination focuses on how OHI information is actively communicated (107).
Several authors highlighted that implementation success depends heavily on leadership engagement and communication. For example, Stansfeld et al (80) found that limited senior management support hindered the effectiveness of a mental-health e-learning intervention, while Larsen et al (62) identified weak internal communication as a barrier to improving nurses’ health literacy. In contrast, Hendriksen et al (46) showed that strong managerial involvement and an enabling culture were linked to reduced sickness absence.
Furthermore, OHI implementations also tend to fail when they do not address the specific health risks or working conditions of the target population (108). For example, Brox & Frøystein (33) found no reduction in sick days following an aerobic fitness intervention in the field of elderly care. However, the intervention failed to address the population’s primary issues, such as neck, shoulder, and back pain, which were likely related to poor posture rather than low activity levels. Additional barriers, such as shift work-hindered attendance, were not adequately addressed and are often overlooked in similar interventions. In contrast, the highest-quality study in our sample with a significant reduction in sickness absence, van de Poll et al (57) reported an impressive mean difference of -15 days. This success can, amongst others, be attributed to the intervention’s individualized approach, which included interviews with both managers and employees, joint problem-solving sessions, and follow-ups to address specific work situations (70, 108).
Lastly, organizations unfamiliar with OHI may struggle with implementation. As Nielsen et al (108) noted cultural fit and change management capacity are key to translating OHI potential into measurable outcomes. As such, organizations with limited prior experience with OHI may encounter greater challenges in adopting such interventions.
Targeting and implementing OHI
Next, we present two frameworks helping decision-makers to decide which OHI to select and how to implement them.
The US the National Institute for Occupational Safety and Health's total worker health (TWH) framework stresses that improving employee well-being starts with changing the cultural, social, and physical environment before targeting individual behavior (109). The framework outlines a five-step hierarchy for targeting OHI strategies, including (i) stressor elimination, (ii) substitution with safer alternatives, (iii) work re-design, (iv) education and training, and (v) behavioral change (110).
Several studies in our sample modified organizational or physical conditions to eliminate stressors. For instance, Åkerström et al (26) implemented an organizational-level job stress program mandating structural work changes (eg, work schedule improvements), while Framke et al (39) introduced participatory organization-level intervention to reduce unnecessary work tasks. On the contrary, many interventions in our sample focused on individual behavior without broader organizational redesign (eg, fitness programs or self-care workshops). From a practical perspective, organizations should assess where they currently stand within the TWH hierarchy and prioritize interventions that address their most pressing deficits, beginning with higher-level structural or organizational changes when these have not yet been established.
While the TWH framework supports the decision on which hierarchy levels to address, the WHO's healthy workplace model offers a holistic eight-step framework (ie, mobilize, assemble, assess, prioritize, plan, do, evaluate, improve) for translating such strategies into practice, keeping leadership engagement and worker participation at the core (111). Applying this model may help overcome several aforementioned implementation barriers. For instance, the mobilize step emphasizes securing top-management engagement and anchoring health as a strategic organizational priority, while the assessment stage promotes systematic evaluation of working conditions through employee input (eg, surveys) to ensure interventions address real needs. The subsequent evaluate–improve cycle supports structured implementation and iterative learning, enabling organizations unfamiliar with OHI to build experience and adapt interventions over time. For practice, the model may offer a pragmatic roadmap to secure successful OHI implementation and enhance effectiveness.
Limitations and research outlook
Methodologically, grey literature was not systematically screened, which may introduce publication bias. Yet, focusing on published peer-reviewed studies ensures a minimum methodological quality and aligns with previous systematic searches (12, 96, 112). Additionally, we focused mainly on sickness absence and ROI; future research could broaden the scope to include presenteeism outcomes measured by validated tools such as the WLQ or the Work Productivity and Activity Impairment (WPAI) scale (113, 114). Additionally future reviews could incorporate physiological and wellbeing-related measures to better understand the full spectrum of OHI effects and contributors.
Second, RCT in workplace health settings are inherently difficult to implement. Strong organizational commitment, often a prerequisite, may bias results positively. Outcomes are shaped by complex real-world factors (eg, leadership behavior and organizational climate), which may not be fully controlled (115). We used the JBI assessment to focus on RCT with high methodological quality.
Moreover, numerous studies evaluated multi-component interventions, making it often challenging to completely isolate the effects by intervention type (eg 33, 61, 64, 68, 75,). Such interventions typically include multiple concurrent strategies (eg, physical exercise combined with mental health counselling and ergonomic adjustments), meaning observed outcomes might result from interactions among these components rather than any single element alone. Excluding these multi-component interventions would have significantly reduced the sample size. Van Dongen et al (87) is one of the few studies to report disaggregated outcomes by intervention type, and a leading example that allows investigators to separate effects by OHI type. To further disentangle mixed-effects of multi-component OHI, future research can use factorial designs or component analyses to disentangle intervention mechanisms clearly and identify the most effective components.
Most of the included studies had follow-up periods of 12–24 months, thus, potential long-term effects of OHI on absenteeism, well-being, and workplace conditions may therefore not be fully captured. Future studies could attempt to extend follow-up periods to capture the effects after two years and beyond.
Older studies mostly evaluated in-person OHI (eg, in-person fitness sessions), thus limiting generalizability to today’s digital or hybrid interventions (eg, app-based exercise programs), where factors like engagement and adherence differ. Digital OHI offer rapid scalability, easier deployment, and reduced set-up costs, potentially increasing ROI (116). These characteristics make them particularly attractive for small and medium-sized enterprises and dispersed or remote workforces. However, factors such as reduced engagement may impact their effectiveness (117). As the landscape of OHI evolves, ongoing evaluations are warranted to assess the comparative value of digital versus in-persona.
This meta-analysis was limited to 23 studies due to missing CI or incompatible outcome formats. Many excluded studies reported directional improvements, suggesting that the true effect size may be underestimated. Adherence to established reporting guidelines [eg, EQUATOR network (118)] could improve future data validity.
Lastly, our review was restricted to studies conducted in OECD countries, limiting generalizability to low- and middle-income contexts, where OHI effectiveness may differ given availability of (financial) resources, differing labor regulations, or distinct cultural attitudes toward OHI and absenteeism. Additionally, our study has shown overrepresentation of European studies (~70%), highlighting a need for increased research in underrepresented regions, such as North America (eg, Canada) and the Asia-Pacific region (eg, Japan).
Concluding remarks
While our meta-analysis reveals no statistically significant effect on absenteeism, there is suggestive evidence that they may offer economic value, particularly in mental health interventions. Yet, the absence of short-term effects on sick days does not necessarily indicate a lack of effectiveness, given benefits such as individual well-being, employee engagement, or team dynamic may not be fully captured by quantitative absenteeism measures. Practically, this review guides decision-makers in selecting the most effective OHI from both absenteeism and economic perspectives and highlights key principles for implementation. Our findings highlight the likely economic value of workplace health promotion. Theoretically, this review enables cross-domain comparison of OHI, sheds light on study quality and heterogeneity of absenteeism and economic related studies, and underscores the need for more standardized evaluation approaches and reporting standards. Future research should measure presenteeism directly, expand beyond OECD contexts, and assess qualitative success factors such as leadership and cultural fit in sustaining OHI impact.