

The COVID-19 pandemic caused by SARS-CoV-2 virus posed a new and potentially fatal occupational hazard. Transmission of SARS-CoV-2 infection could be expected not only within households, and through private and public social contacts in leisure time, but also in the workplace – and particularly in jobs (equivalent to ‘occupations’ throughout) that entail frequent close contact with other people or selective contact with infected individuals (1–3). Transmission in the workplace would both lead to potentially lethal occupational disease among employees and accelerate the spread of infection across society (2). Understanding of the risks of COVID-19 by occupation is important from both perspectives. It is needed to both prioritize public health interventions aimed at containing the spread of the epidemic and optimize protection of workers’ health. In addition, it is important to inform decisions on compensation for COVID-19 as an occupational disease.
Ideally, research into risks of COVID-19 by occupation would be based on cases ascertained through systematic prospective follow-up of large cohorts of workers, with regular ascertainment of symptoms, clinical signs, and polymerase chain reaction (PCR) testing. As that has not been feasible, researchers have been forced to use proxy measures of incidence based on: PCR testing (4–11), measurements of specific immunoglobulins against SARS-CoV-2 (12–14), symptoms and sickness absence (6), COVID-19 related hospital admission (7, 15, 16), or mortality from the disease (7, 15, 17–22). In most studies to date, with broad coverage of occupations, mortality from COVID-19 has been the outcome measure (7, 15, 17–22).
While the majority of studies so far have focused on healthcare workers (1, 5–9, 12–14, 21, 23–29), a number of studies in the first year of the pandemic have indicated that risk may also be increased in other occupations (16, 18–20, 22). For instance, an English mortality study, which included about 2 500 COVID-19 related deaths, found that taxi and bus drivers, shop assistants, and social workers had up to four-fold increases in age-adjusted mortality (19), and a Swedish national study also observed increased mortality in taxi and bus drivers (18). A Norwegian study found increased risk of COVID-19 related hospitalization in dentists, but numbers were small (4). A Swedish study found substantially increased risk of COVID-19 hospitalization among employees, who according to a job exposure matrix (JEM) worked in close proximity to other people or had contact with infected patients (16).
As yet, however, few studies have quantified differences in risk of severe disease across highly specific occupations. Among research priorities outlined in an editorial, identification of specific occupations at high risk of COVID-19 was considered of high value as preparation for future pandemics (30). The attention to precautions and protective equipment among healthcare professionals is probably high compared to other occupations, where the awareness of risk may be far less, and more training and protection needed. According to a newly developed expert-rated JEM (31), 87% of the total of 423 job groups of the International Standard Classification of Occupations (ISCO-08) may carry a higher risk of SARS-CoV-2 infection. This accounts for 85% of Danish employees, of whom <15% are working in the healthcare sector.
The aim of the current study was to systematically quantify the risk of COVID-19-related hospital admission among employees across all occupations with >2000 employees during the first two years of the pandemic. Hospital admission was considered a proxy for severe COVID-19. The study took advantage of access to updated information in a large nationwide cohort. We focused on hospital admission as an outcome to achieve greater statistical power than an analysis of mortality, and to avoid the possibility of bias from differential access to testing by occupation (32).
Methods
Population
The study cohort comprised all Danish employees aged 20–69 years at 1 January 2020 (N=2 451 542). It was identified from records in the Work Classification Module at Statistics Denmark, as a subset of the Danish Occupational Cohort with eXposure data (DOC*X) (33). Other persons from the same households as cohort members (N=1 503 892, 74% ≤20 years of age; 1.4% ≥70 years of age) were identified through the residential address in order to account for viral transmission in the family. Permissions to remotely retrieve, compile and analyze pseudonymized data at a secured and logged platform at Statistics Denmark were obtained from the Danish Data Protection Agency (P-2020-897), Statistics Denmark (P-708121) and the National Board of Health Data (FSEID-00005368). This process started in August 2020, and access to the data-files was provided in December 2021.
Occupation and industry
Occupation and industry codes are primarily provided by employing companies but other sources of information such as tax records, trade union membership, and educational records are also used by Statistic Denmark. This allowed assignment of job titles according to the Danish version of the International Standard Classification of Occupations (DISCO-08) (34), for 86% at the 4-digit level, and assignment of industry codes according to the Danish version of the Statistical Classification of Economic Activities in the European Communities (DB07) (35) for 100% at the 2-digit level. When we retrieved data for this study in December 2021, the most updated information on occupational and economic activity codes was from December 2019. Therefore, we did not have data on changes of occupation in 2020 and 2021. With few exceptions, the Danish classifications are identical to the corresponding international classifications (ISCO-08 and NACE Rev. 2).
With one exception, it was not possible to infer missing DISCO-08 codes from known DB07 codes because individual DB07 codes are associated with a wide miscellany of DISCO-08 codes. However, as 75% of employees within ‘hairdressing and other beauty treatment’ (DB07 code 96.02.10) were hairdressers (DISCO-08 code 5141), all individuals with a missing DISCO-08 code within this industry (N=1135) were assigned the 5141 DISCO-08 code.
Outcome ascertainment
Data on admission to hospital for COVID-19-related disease from 1 January 2020 through 14 December 2021 were obtained from a daily updated database with national coverage kept at Statens Serum Institut, Copenhagen. A hospital admission was defined as COVID-19 related if a SARS-CoV-2 PCR swab test was positive up to 14 days prior to admission, and if the hospital stay was >12 hours (an algorithm used by Statens Serum Institut). An examination of ICD-10 diagnoses available from the National Patient Registry indicated that about 2.5% of cases using this definition were probably attributable to other causes such as psychiatric, traumatic, or obstetric disorders.
Reference group
The reference group was defined a priori as occupations classified to the lowest level of potential occupational exposure to SARS-CoV-2 by an expert-rated COVID-19 JEM (31). Eight domains addressing four factors on transmission risk (type, number, proximity, and location of social contacts at work), two mitigation measures (social distancing and face covering) and two job insecurity factors (income insecurity and proportion of migrants) were each rated on a scale from 0 (low risk of exposure) to 3 (high risk of exposure). The reference group was defined by the 50 job codes (4-digit DISCO-08 level) with low risk on each of the eight dimensions (sumscore1-8 = 0, N=369 341, 15% of the study cohort). The three largest job groups in the reference population were general office clerks, commercial sales representatives, and accounting associate professionals (41% of the reference group, DISCO-08 codes 4110, 3322 and 3313, respectively).
An overview of the subsets of the study population is displayed in table 1.
Table 1
Overview of the study population (numbers). COVID-19 risk estimates are provided for employees in the subgroups indicated with bold. [JEM=job exposure matrix.]
| Employees | 4-digit DISCO-08 occupations | Incident COVID-19 cases | |
|---|---|---|---|
| At-risk a occupations with >2000 employees | 1 620 231 b | 155 | 2944 |
| Industrial sector (DB07) with average 4-digit-DISCO-08 JEM sumscore <12–24 | 853 599 | 155 | 1751 |
| JEM sumscore 1–12 | 126 575 | 97 | 183 |
| JEM sumscore >12–24 | 727 024 c | 58 | 1568 |
| Industrial sector (DB07) with average 4-digit-DISCO-08 JEM sumscore 1–12 | 766 632 | 155 | 1193 |
| At-risk a occupations with ≤2000 employees | 124 287 | 218 | 220 |
| Referent occupations d | 369 341 | 50 | 559 |
| Missing 4-digit DISCO-08 codes | 337 306 | 693 | |
| Dead before start of follow-up week 8, 2020 | 377 | 0 | |
| Entire study population | 2 451 542 | 423 | 4416 |
Covariates
Using their unique personal identification numbers, we linked each cohort member with records in public registers hosted by Statistics Denmark to obtain information on a range of demographic, social and health variables at the end of 2019: sex, age, duration of education in years, country of origin, social position, household income, hospital admission for ≥1 of 11 chronic diseases during 2010–2019, geographical residential area and living in a municipality with a large city.
From data on household members, we defined variables indicating the size of the household sharing the same residence. The number of family members (excluding the index-person), who had ≥1 PCR swab test during the second or third week before any particular week during follow-up, and the results of those tests, were retrieved from the national testing database, which by mid December 2021 included results of about 40 million PCR tests. Tests were available free of charge throughout the country from early on in the first epidemic wave. The 2–3 week interval was specified to account for incubation period and disease development before hospitalization
Individual proxies of lifestyle factors in terms of sex-, age- and period-specific probability of current smoking and estimates of body mass index (kg/m2) were assigned by lifestyle JEM based on questionnaire information from several large random samples of the Danish population representative for 2010 (36).
From the DREAM register with longitudinal data on public benefit transfer payments to all Danish citizens (37), we obtained data on retirement each week during 2020 (data not available for 2021). Finally, we obtained information on the date of second vaccination against COVID-19 (if any) and vital status during 2020 and 2021.
Statistical analysis
We examined incident hospital admission for COVID-19 related disease as a function of occupation and covariates. Crude and adjusted measures of association, in terms of incidence rate ratios (IRR) with 95% confidence intervals (CI), were computed by Poisson regression applied to counts of COVID-19 hospital admissions and weeks at-risk for all covariate cross tabulations. Follow-up started in week 8 of 2020 (the week before first hospital admissions for COVID-19 in Denmark) and continued until (and including) week 50 of 2021 (the last week with available data on COVID-19 admissions). Follow-up was censored at the first of: COVID-19 related hospital admission (N=4416); death (N=2615); emigration (N=18 112); retirement (N=33 427); or week 50 of 2021.
A power calculation based upon the outcome occurrence in the reference group indicated that a relative risk of 1.8 would be detectable in an occupation with 80% power at the 5% significance level if it included >2000 employees. Therefore, we report risk estimates for the non-referent occupations of this size or larger, while keeping all jobs regardless of size in the reference group. Occupations with ≤2000 employees and employees with missing DISCO-08 codes were analyzed as separate categories.
Risk estimates by industrial sector. To account for possible differences between the same occupation in different industrial sectors – for instance cleaners in hospitals versus cleaners in office buildings and nursing aides in institutions versus nursing aides in private homes – we present occupational risk stratified by industrial sectors with more likely exposure to SARS-CoV-2. These industrial sectors were selected by an average COVID-19 JEM sum score >12 (the median) for industries classified at the 2-digit DB07 level. DB07 groups were pooled when appropriate, considering type of industrial sector (for instance land-, sea and air transportation, DB07 codes 49, 50 and 51). In few instances we deviated from the 4-digit DISCO-08 classification by splitting the 4-digit groups into 6-digit groups to distinguish more specific occupations (for instance day care assistants by age of the children taken care of) or to pool 4-digit groups into 3-digit groups to obtain sufficient sample size – for instance generalist and specialized medical practitioners or waiters/bartenders (explicitly detailed in table 2). Separate risk estimates are reported for occupations with a COVID-19 JEM sum score >12 but for completeness a summary risk estimate for all occupations with COVID-19 sum scores ≤12 is also provided.
Table 2
Risk of Covid-19 related hospital admission in occupations with >2000 employees working in industrial sectors (2-digit DB07) and occupations (DISCO-08) with a COVID-19 job exposure matrix sumscore >12. Incidence rate ratios (IRR) with 95% confidence limits (CI) relative to employees in all occupations with unlikely occupational exposure to SARS-CoV-2 a. Significant associations in bold.
| Occupation (descending number employees) | DISCO-08 code | Employees (N) | COVID-19 admissions (N) | IRR (sex and age adjusted) | IRR fully adjusted b | 95% CI |
|---|---|---|---|---|---|---|
| HEALTHCARE (db07 code 86) | ||||||
| Nursing Professionals | 2221 | 51 156 | 104 | 1.65 | 1.89 | 1.42–2.50 |
| Medical Practitioners | 2211, 2212 | 18 518 | 44 | 1.64 | 2.03 | 1.27–3.25 |
| Dental Assistants and Therapists | 3251 | 8068 | 12 | 1.34 | 0.96 | 0.53–1.75 |
| Healthcare Assistants | 532120 | 7142 | 35 | 3.50 | 3.54 | 2.34–5.36 |
| Physiotherapists | 226410 | 6541 | 8 | 0.98 | 1.30 | 0.63–2.70 |
| Medical Laboratory Technicians | 3212 | 6229 | 16 | 2.06 | 1.86 | 1.06–3.24 |
| Psychological Therapists | 2634 | 5052 | 12 | 1.91 | 2.52 | 1.37–4.65 |
| Cleaners and Helpers | 9112 | 4045 | 15 | 2.59 | 1.53 | 0.87–2.69 |
| Recreational Therapists | 226910 | 3798 | 8 | 1.78 | 2.35 | 1.10–5.02 |
| Dentists | 226100 | 3351 | 6 | 1.26 | 1.23 | 0.54–2.80 |
| Hospital Attendants (porters) | 532130 | 3172 | 12 | 1.97 | 1.94 | 1.06–3.56 |
| X-ray Technicians | 3211 | 2438 | 7 | 2.22 | 2.22 | 1.04–4.73 |
| Midwifery Professionals | 2222 | 2042 | <5 | 0.91 | 1.05 | 0.26–4.24 |
| COVID-19 JEM sumscore 1-12 | 25 189 | 51 | 1.52 | 1.61 | 1.20–2.17 | |
| 2000 employees | 2864 | 10 | 1.91 | 2.08 | 1.08–3.98 | |
| Missing DISCO-08 code | 11 762 | 18 | 1.12 | 1.47 | 0.65–3.33 | |
| SOCIAL CARE (DB07 code 87-88) | ||||||
| Special Teaching Professionals | 2357 | 31 529 | 50 | 1.10 | 1.10 | 0.78–1.55 |
| Nursing Aides (institutions) | 5321 | 27 224 | 62 | 1.66 | 1.43 | 1.06–1.94 |
| Homecare Aides, private homes (DB07 8810) | 532210 | 26 134 | 69 | 1.95 | 1.22 | 0.90–1.64 |
| Nursing Aides (private homes) | 532220 | 21 313 | 61 | 2.17 | 1.67 | 1.21–2.29 |
| Teachers/Daycare Assistants. 0-3 years (DB07 889120) | 531120 | 17 908 | 29 | 1.25 | 1.24 | 0.85–1.81 |
| Teachers/Daycare Assistants.4-7 years (DB07 889130) | 531120 | 11 150 | 29 | 1.83 | 1.56 | 1.07–2.28 |
| Teachers/Daycare Assistants.7-15 years ((DB07 889140) | 531120 | 4388 | 6 | 1.11 | 0.93 | 0.41–2.08 |
| Nursing Professionals | 2221 | 11 103 | 26 | 1.76 | 1.81 | 1.18–2.77 |
| Family Daycare Workers | 531110 | 9900 | 13 | 0.92 | 0.96 | 0.55–1.68 |
| Social Work and Counselling Professionals | 263500 | 4314 | 5 | 0.89 | 0.88 | 0.36–2.13 |
| Cleaners | 9112 | 4178 | 17 | 2.78 | 1.41 | 0.84–2.36 |
| Primary School Teachers | 2341 | 3316 | 5 | 1.11 | 1.05 | 0.43–2.54 |
| Kitchen Helpers | 9412 | 2353 | <5 | 1.31 | 2.02 | 0.73–5.59 |
| Physiotherapists | 2226 | 2184 | 5 | 1.54 | 1.03 | 0.42–2.52 |
| COVID-19 JEM sumscore 1-12 | 112 577 | 253 | 1.64 | 1.28 | 1.07–1.52 | |
| ≤2000 employees | 2195 | <5 | 1.23 | 0.98 | 0.37–2.62 | |
| Missing DISCO-08 code | 14 157 | 31 | 1.50 | 1.12 | 0.62–2.01 | |
| EDUCATION (DB07 code 85) | ||||||
| Primary School Teachers | 2341 | 72 524 | 113 | 1.09 | 1.16 | 0.93–1.45 |
| University and Higher Education Teachers | 2310 | 28 225 | 26 | 0.64 | 0.67 | 0.44–1.01 |
| Secondary Education Teachers | 233010 | 13 811 | 15 | 0.74 | 0.87 | 0.52–1.48 |
| Early Childhood Educators | 2343 | 12 487 | 22 | 1.25 | 1.21 | 0.78–1.86 |
| Vocational Education Teachers | 2320 | 10 074 | 13 | 0.74 | 0.77 | 0.44–1.34 |
| Preschool Child Helpers | 531120 | 5327 | 12 | 1.62 | 1.37 | 0.77–2.45 |
| Education Managers | 134500 | 4450 | <5 | 0.50 | 0.57 | 0.21–1.54 |
| Cleaners | 9112 | 3704 | 14 | 2.40 | 1.60 | 0.89–2.87 |
| COVID-19 JEM sumscore 1-12 | 27 185 | 60 | 1.40 | 1.39 | 1.04–1.85 | |
| ≤2000 employees c | 6046 | 16 | 1.63 | 1.60 | 0.97–2.64 | |
| Missing DISCO-08 code | 9248 | 20 | 1.42 | 1.29 | 0.65–2.57 | |
| TRANSPORTATION (DB07 code 49-51) | ||||||
| Heavy Truck and Lorry Drivers | 8332 | 14 351 | 22 | 0.78 | 0.84 | 0.52–1.36 |
| Bus and Tram Drivers | 8331 | 10 775 | 93 | 4.35 | 2.46 | 1.79–3.40 |
| Car, Taxi and Van Drivers | 8322 | 2858 | 18 | 3.37 | 1.60 | 0.94–2.70 |
| Locomotive Engine Drivers | 8311 | 2361 | 7 | 1.41 | 1.23 | 0.58–2.61 |
| Travel Attendants and Travel Stuarts | 5111 | 2090 | <5 | 0.66 | 0.63 | 0.15–2.58 |
| COVID-19 JEM sumscore 1-12 | 8312 | 15 | 1.03 | 0.84 | 0.50–1.43 | |
| ≤2000 employees | 5987 | 12 | 1.04 | 0.92 | 0.51–1.65 | |
| Missing DISCO-08 code | 14 576 | 70 | 2.79 | 1.49 | 1.12–1.97 | |
| RETAIL SALES (DB07 code 47) | ||||||
| Shop Sales Assistants, non-specialized (DB07 4711- 4719) | 5223 | 17 734 | 22 | 1.03 | 0.94 | 0.59–1.50 |
| Shop Sales Assistants, specialized (DB07 472-78) | 5223 | 36 771 | 51 | 1.16 | 1.15 | 0.82–1.62 |
| Cashiers and Ticket Clerks | 5230 | 12 804 | 15 | 0.97 | 0.93 | 0.54–1.61 |
| Retail Trade Managers | 142010 | 5962 | 10 | 1.17 | 1.24 | 0.65–2.35 |
| Service Station Attendants | 5245 | 3592 | <5 | 0.71 | 0.56 | 0.18–1.79 |
| Pharmaceutical Technicians and Assistants | 3213 | 3267 | 7 | 1.77 | 1.27 | 0.59–2.73 |
| Shelf Fillers | 9334 | 3248 | 9 | 1.96 | 1.41 | 0.71–2.80 |
| Butchers and Fishmongers | 7511 | 2973 | <5 | 0.95 | 1.15 | 0.42–3.13 |
| COVID-19 JEM sumscore 1-12 | 15 204 | 22 | 1.02 | 0.91 | 0.59–1.42 | |
| ≤2000 employees | 3984 | 12 | 2.20 | 2.15 | 1.21–3.82 | |
| Missing DISCO-08 code | 20 760 | 32 | 1.12 | 0.94 | 0.65–1.35 | |
| ACCOMODATION, FOOD, BUILDING, PERSONAL AND PROTECTIVE SERVICES, RECREATION ACTIVITY (DB07 codes 55, 56, 81, 93, 96) | ||||||
| Cleaners and Helpers (except private homes) | 9112 | 27 849 | 107 | 2.82 | 1.20 | 0.89–1.61 |
| Cooks | 5120 | 10 496 | 9 | 0.67 | 0.50 | 0.25–0.99 |
| Waiters and Bartenders | 5131, 5132 | 10 332 | 9 | 0.84 | 0.67 | 0.34–1.33 |
| Protective Service Workers | 5411-5419 | 21 843 | 51 | 1.42 | 1.24 | 0.92–1.68 |
| Kitchen Helpers | 9412 | 7658 | 14 | 1.54 | 0.89 | 0.51–1.56 |
| Building Caretakers | 5153 | 5660 | 15 | 1.35 | 1.18 | 0.69–2.04 |
| Hairdressers and Cosmetologists | 514 | 5398 | 10 | 1.74 | 1.49 | 0.74–3.01 |
| Fast Food Preparers | 9411 | 3610 | <5 | 0.48 | 0.36 | 0.09–1.47 |
| Gardeners and Horticultural Growers | 6113 | 2742 | <5 | 0.23 | 0.23 | 0.03–1.64 |
| Hotel Receptionists | 4224 | 2679 | <5 | 0.66 | 0.54 | 0.13–2.20 |
| COVID-19 JEM sumscore 1-12 | 22 311 | 37 | 1.04 | 0.87 | 0.61–1.24 | |
| ≤2000 employees c | 12 786 | 31 | 1.66 | 1.38 | 0.95–2.02 | |
| Missing DISCO-08 code | 50 569 | 143 | 2.19 | 2.03 | 0.77–5.32 | |
| Reference (all occupations with unlikely occupational SARS-CoV-2 exposure) a | 369 341 | 559 | 1.00 | 1.00 |
a Likelihood of occupational SARS-CoV-2 exposure according to a population-based international expert-rated job exposure matrix that assesses four measures of number of close indoor contacts at work, two mitigation measures and two job insecurity measures, each rated on a scale from low (0) to high (3),
b Adjustment for sex, age (10 year groups), duration of education at baseline (5 groups), number of hospital admissions for one or more of 11 chronic diseases in the 10 years preceding start of the pandemic (0, 1, >1), country of origin (4 categories), geographical region (5 groups), number of household members (0, 1, 2, 3+), probability of tobacco smoking (<10%, 10-<20%, 20+ %), bodymass index (< 25 kg/m2 / ≥ 25 kg/m2), family positive PCR swab test (at least one member of the family besides the index person with positive PCT test during the previous 2-3 weeks, yes/no) and Covid-19 vaccination (from date of second vaccination until end of follow-up).
Risk estimates across all industrial sectors. Using the average JEM sum score to select industrial sectors and, within these, occupations of particular interest, there is a risk of leaving out occupations that score high on some COVID-JEM dimensions (for instance number of daily contacts and work with the general public), while scoring low on other dimensions (for instance job insecurity). For that reason and to provide a full systematic quantification of occupational risk independent of industrial sector and COVID-19 JEM assessment, we estimated the risk for all non-referent occupations with >2000 employees at the 4-digit DISCO-08 level while keeping occupations with ≤2000 and employees with missing DISCO-08 data as separate categories.
Adjustments. In all analyses, we first adjusted the risk estimate by sex and age, which are strongly related to both occupation and outcome (being a male and higher age conferring a higher risk). Secondly, we further adjusted for a fixed set of baseline variables according to the disjunctive confounder variable selection criteria (38). Included covariates are listed in the footnote to table 2 which also displays grouping categories. Social position, household income, number of children in the household and living in a large city were also considered as possible confounding factors but were not included in final statistical models because of strong overlap with other covariates within the same domain. Retirement, death, and emigration during follow-up were accounted for by censoring, while COVID-19 vaccination was controlled for by a time-varying variable.
All analyses were carried out in SAS 9.4 (SAS Institute, Cary, NC, USA).
Results
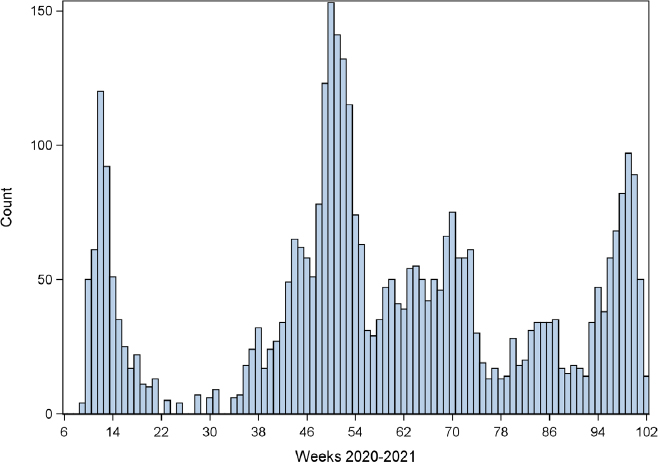
During 228.2 million person-weeks, we observed 4416 COVID-19 related hospital admissions peaking in weeks 12 and 50 of 2020, and week 47 of 2021 (figure 1, entire study population N=2 451 542). The corresponding numbers for the 155 occupations with >2000 employees and referents were 185.6. million person-weeks with 3 503 incident cases) The first vaccinations against COVID-19 took place in week 52 of 2020.
Figure 1
Weekly numbers of COVID-19 hospital admissions (total = 4 416) among employees (n = 2 451 542 in Denmark from week 8 of 2020 through week 50 of 2021 (data are omitted for weeks with fewer than 5 cases)
Occupational risk by industrial sector
We identified six major industrial sectors defined by the 2-digit DB07 level with an average COVID-19 JEM sum score >12. Increased risk of COVID-19 related hospital admission was observed in one or more 4-digit DISCO-08 occupations within three of these (healthcare, social care and transportation), but not in education, retail sales and a heterogeneous group of service jobs) (table 2).
Within healthcare, eight of thirteen occupations with ≥2000 employees had an increased risk, with health care assistants experiencing the highest risk, and physiotherapists, midwives, dentists and dental assistants as notable exceptions (table 2).
In social care, four out of fourteen occupations had increased risk, the highest IRR being in nurses. Nursing aides (in institutions and private homes, respectively) and teachers/day care assistants for children aged 4–7 also had increased risk, while primary school teachers and social work and counselling professionals had not.
Among five jobs in the transportation sector, increased risk was seen among bus and possibly taxi drivers but not lorry and locomotive engine drivers.
Occupational risk across all industrial sectors
Computation of IRR by 4-digit DISCO-08 occupations across all industrial sectors independently of COVID-19 JEM assessments revealed few additional occupations with elevated risk not captured by the industrial sector stratified analysis. These include construction managers, medical imaging and equipment operators, chefs, early childhood educators and food and related products machine operators (table 3 and supplementary material www.sjweh.fi/article/4063, table S1). Moreover, low risk was seen in seven occupations, mainly some high-skill and blue-collar occupations (supplementary table S1).
Table 3
Risk of Covid-19 related hospital admission for 155 non-referent 4-digit DISCO-08 occupations with > 2000 employees across all industrial sectors. Incidence rate ratios (IRR) with 95% confidence limits relative to employees in all occupations with unlikely occupational exposure to SARS-CoV-2 a. The Table is continued in supplemental table 1.
| Occupation (descending fully adjusted IRR) | DISCO-08 code | N employees | N Covid-19 admissions | IRR sex and age adjusted | IRR fully adjusted b | 95% CI |
|---|---|---|---|---|---|---|
| Construction Managers | 1323 | 3 326 | 13 | 2.04 | 2.22 | 1.28–3.85 |
| Medical Imaging and Equipment Operators | 3211 | 2 646 | 8 | 2.25 | 2.20 | 1.09–4.42 |
| Bus and Tram Drivers | 8331 | 10 879 | 93 | 4.35 | 2.13 | 1.64–2.77 |
| Chefs | 3434 | 2 949 | 10 | 2.21 | 2.02 | 1.07–3.84 |
| Generalist Medical Practitioners | 2211 | 19 826 | 46 | 1.60 | 1.93 | 1.28–2.91 |
| Psychologists | 2634 | 8 072 | 15 | 1.43 | 1.90 | 1.11–3.26 |
| Human Resource Managers | 1212 | 2 884 | 9 | 1.87 | 1.90 | 0.98–3.68 |
| Nursing Professionals | 2221 | 63 600 | 134 | 1.64 | 1.87 | 1.51–2.33 |
| Dairy Products Makers | 7513 | 3 144 | 8 | 1.53 | 1.81 | 0.89–3.68 |
| Social Work Associate Professionals | 3412 | 7 019 | 23 | 2.14 | 1.77 | 1.14–2.76 |
| Health Professionals Not Elsewhere Classified | 2269 | 8 856 | 15 | 1.38 | 1.77 | 1.02–3.05 |
| Healthcare Assistants | 5321 | 44 641 | 134 | 2.18 | 1.72 | 1.35–2.18 |
| Medical and Pathology Laboratory Technicians | 3212 | 6 785 | 17 | 1.93 | 1.68 | 1.00–2.83 |
| Packing, Bottling and Labelling Machine Operators | 8183 | 2 166 | 8 | 2.18 | 1.68 | 0.83–3.39 |
| Process Control Technicians Not Elsewhere Classified | 3139 | 2 399 | 7 | 1.65 | 1.64 | 0.78–3.46 |
| Software and Applications Developers and Analysts Not Elsewhere | 2519 | 4 398 | 12 | 1.63 | 1.59 | 0.89–2.82 |
| Medical Secretaries | 3344 | 9 853 | 19 | 1.48 | 1.57 | 0.99–2.48 |
| Receptionists (general) | 4226 | 3 620 | 8 | 1.77 | 1.56 | 0.77–3.18 |
| Journalists | 2642 | 9 748 | 18 | 1.25 | 1.44 | 0.90–2.31 |
| Home-based Personal Care Workers | 5322 | 86 458 | 247 | 2.18 | 1.43 | 1.16–1.78 |
| Food and Related Products Machine Operators | 8160 | 17 038 | 57 | 1.98 | 1.43 | 1.05–1.95 |
| Police Officers | 5412 | 9 913 | 22 | 1.30 | 1.42 | 0.93–2.18 |
| Physiotherapists | 2264 | 9 615 | 13 | 1.05 | 1.38 | 0.78–2.46 |
| Personal Services Workers Not Elsewhere Classified | 5169 | 4 408 | 12 | 1.81 | 1.37 | 0.76–2.46 |
| Musicians, Singers and Composers | 2652 | 2 818 | 6 | 1.35 | 1.37 | 0.61–3.07 |
| Locomotive Engine Drivers | 8311 | 2 375 | 7 | 1.43 | 1.36 | 0.65–2.88 |
| Special Needs Teachers | 2352 | 3 895 | 7 | 1.16 | 1.35 | 0.60–3.04 |
| Real Estate Agents and Property Managers | 3334 | 3 134 | 6 | 1.31 | 1.35 | 0.60–3.02 |
| Manufacturing Managers | 1321 | 6 730 | 15 | 1.11 | 1.35 | 0.80–2.25 |
| Contact Centre Information Clerks | 4222 | 5 045 | 10 | 1.60 | 1.35 | 0.71–2.55 |
| Early childhood educators | 2343 | 70 233 | 133 | 1.42 | 1.34 | 1.10–1.63 |
| Contact Centre Salespersons | 5244 | 6 297 | 12 | 1.37 | 1.31 | 0.73–2.35 |
| Electronics Engineering Technicians | 3114 | 4 745 | 12 | 1.33 | 1.30 | 0.73–2.30 |
| Building Frame and Related Trades Workers Not Elsewhere Classified | 7119 | 3 309 | 10 | 1.67 | 1.29 | 0.68–2.45 |
| Chemical and Physical Science Technicians | 3111 | 9 663 | 22 | 1.57 | 1.28 | 0.83–1.96 |
| Protective Services Workers Not Elsewhere Classified | 5419 | 3 745 | 10 | 1.61 | 1.27 | 0.67–2.40 |
| Hairdressers | 5141 | 5 466 | 10 | 1.68 | 1.25 | 0.66–2.36 |
| Missing 4-digit DISCO-08 code | 337 306 | 693 | 1.35 | 1.11 | 0.81–1.53 | |
| Occupations with less than 2000 employees | 124 287 | 220 | 1.07 | 1.08 | 0.91–1.28 | |
| Reference (all occupations with unlikely occupational SARS-CoV-2 exposure)1 | 369 341 | 559 | 1.00 | 1.00 |
a Likelihood of occupational SARS-CoV-2 exposure according to a population-based international expert-rated job exposure matrix that assesses four measures of number of close indoor contacts at work, two mitigation measures and two job insecurity measures, each rated on a scale from low (0) to high (3),
b Adjustment for sex, age (10 year groups), duration of education at baseline (5 groups), number of hospital admissions for one or more of 11 chronic diseases in the 10 years preceding start of the pandemic (0, 1, >1), country of origin (4 categories), geographical region (5 groups), number of household members (0, 1, 2, 3+), probability of tobacco smoking (<10%, 10-<20%, 20+ %), bodymass index (< 25 kg/m2/ ≥ 25 kg/m2), family positive PCR swab test (at least one member of the family besides the index person with positive PCT test during the previous 2-3 weeks, yes/no) and Covid-19 vaccination (from date of second vaccination until end of follow-up). Significant associations in bold.
Supplementary results
As expected, several demographic and social characteristics were unevenly distributed across categories of the COVID-19 JEM sum score, in particular, sex, age, duration of education and country of birth. Differences were less pronounced regarding size of household, health, and lifestyle (supplementary table S2).
Strong and robust sex- and age-adjusted associations were seen between COVID-19 related hospital admission and most covariates other than body mass index and positive PCR swab test of one or more family members in the previous 2–3 weeks (supplementary table S3)
Discussion
In this nationwide registry-based follow-up study of COVID-19 related hospital admission during the first two years of the pandemic in Denmark, we observed increased risk in most occupations within healthcare, in several occupations within social care, and in a few occupations within transportation and various other occupations. Adjusted IRR in these at-risk occupations were generally in the range of 1.5–3. No increased risk was seen in the educational and retail sales sectors or in a number of service professions. Our analysis had the strength of being based on a large national cohort, but several potential sources of bias need consideration.
Methodological issues
Hospital admission is not a perfect proxy for incidence of COVID-19. Admission rates among infected individuals are higher among those who are older, male, of non-white ethnicity, with various comorbidities, and have an unhealthy lifestyle (39, 40). To reduce any resultant bias, we adjusted risk estimates for age, sex, country of origin, history of hospital admission for other diseases, body mass index and tobacco smoking. Immunization, once it became available, will have reduced individual vulnerability to more severe infection requiring hospital admission, and therefore was a further factor of adjustment. There is also potential for confounding by non-occupational exposure to COVID-19. To reduce this bias, we adjusted for years of education, household size, and recent documentation of infection in a household member. A further complication is that during the study period, incidence of COVID-19 varied by region within Denmark, which could lead to bias where jobs were not uniformly distributed across the country. Therefore, we included adjustment for region. Despite these many adjustments, we cannot exclude some residual bias – for instance, we had no data on commuting to work by public transport.
A large number of comparisons inevitably produces chance associations, and real associations cannot be distinguished from spurious associations on statistical grounds. The main approach taken to address the multi-comparison problem was to focus on occupations that according to independent expert ratings a priori were more likely to confer increased risk of viral infection. Nevertheless, it should be acknowledged that demonstration of increased (or reduced) risk in some occupations could be the result of random variation regardless of statistical significance. Cautious interpretation and critical assessment of plausibility are needed before specific results are communicated or actions taken based upon findings related to specific occupations. The detail provided by stratification of jobs by industrial sector may be helpful in risk assessment because we expect that the same jobs in different sectors will in some cases have different risks. On the other hand, real risks in some occupations may have been missed because of small numbers. It was, for example, unexpected that the risk in midwives was not elevated, although an explanation might be that both pregnant women and midwives have been unusually careful to avoid infection.
Positive PCR swab tests among family members were only weak predictors of COVID-19 related hospital admission 2–3 weeks later despite an extremely high testing activity, particularly during the second year of the epidemic. This finding cannot be taken as strong evidence that viral transmission in the family is of minor importance. Since positive PCR tests are strongly clustered in families in time – many performed within hours the very same day – the sequence of positive testing in a family may not be a reliable indicator of the sequence of infection. Moreover, in spite of high test-activity, there may still be many undetected subclinical cases.
The follow-up period included the first two epidemic waves and the initial part of the third wave. The end of follow-up coincided with a time when the less virulent omicron virus variant outnumbered the more lethal alpha, beta, and delta variants. However, there is no reason to expect that this change will have affected occupations differentially, and therefore it should not have been a source of bias.
Context and implications of findings
When comparing results across studies undertaken in different places and over different time periods, there is a possibility that differences in risk estimates could reflect not only the effects of bias and chance, but also variation in the extent of societal lockdown and effectiveness of precautionary measures as implemented in different countries at different stages of the pandemic. Results reported here may not apply to other countries or other time periods. Nevertheless, our findings are broadly consistent with those from elsewhere. They corroborate several earlier reports of increased risk among healthcare workers (1, 5–9, 12–14, 16, 21, 23–27), adding information on risk in various specific occupations not previously addressed in this sector – for instance medical laboratory technicians, hospital porters and psychologists. Increased risk among bus drivers has also been reported previously (18, 19). Elevated risk among shop assistants was observed in a mortality study (17) but not in our study. The absence of increased risk among teachers is notable, and again accords with other investigations (4, 41). That risk was increased in day care assistants providing daytime care for 4–7-year-old children might reflect closer contacts than experienced by primary school teachers, or that the latter were working from home when the epidemic peaked in Denmark in spring 2020 and winter 2021–22.
To the extent that the observed risk estimates reflect viral transmission related to working in a particular occupation, our data indicate that in the population and time period studied, recommendations and precautions to mitigate risk were insufficient and need to be revisited by employers and the Labour Inspection Agencies. When working at home is infeasible during periods with high community prevalence of infection, there is a need to develop and implement job- and task-specific guidelines based on the well-established general recommendations. At the same time, the demonstration of increased risk of infection in certain occupations may suggest interventions to protect the public more widely. For instance, elevation of risk among hairdressers might imply an increased risk for customers and family members too. As yet, however, there is little direct evidence of onward household transmission from people working in high-risk occupations (28, 42).
In most occupations where no or only marginally elevated risks (IRR <1.1) were observed, it seems likely either that viral transmission was not occurring in the workplace or that precautions were sufficient to mitigate it – as for instance in the travel, hotel and restaurant businesses, which have been locked down for long periods during the pandemic.
Significantly low risk estimates may have occurred in some jobs because limited contact with other people at work meant that SARS-CoV-2 transmission was lower than during leisure-time activities. Alternatively, they could be a consequence of random sampling variation in a context of multiple testing, or the reference groups used may not adequately have represented the lowest occupational exposure levels. The COVID-19 JEM was based upon subjective expert ratings and has so far not been validated (31).
The excessive societal impact of the COVID-19 pandemic may have consequences for occupational health reaching beyond the pandemic itself. In general, transmission of infectious diseases in the workplace has not been given high priority either in research agendas or in occupational health prevention programs (43, 44). This situation my change as documentation of the impact of workplace transmission of COVID-19 becomes stronger and widely accepted.
Concluding remarks
Our study provides strong evidence that the workplace has been an important setting for viral transmission during the SARS-CoV-2 pandemic in Denmark, and that lock-down and other measures to reduce such transmission have not been fully effective. Ways should be sought to reduce risk further, especially in health and social care, and among bus and taxi drivers. In addition, there is mounting evidence to support compensation for COVID-19 as an occupational disease in a number of jobs.